British West Indian vs Immigrants from Morocco Child Poverty Under the Age of 5
COMPARE
British West Indian
Immigrants from Morocco
Child Poverty Under the Age of 5
Child Poverty Under the Age of 5 Comparison
British West Indians
Immigrants from Morocco
21.4%
CHILD POVERTY UNDER THE AGE OF 5
0.0/ 100
METRIC RATING
291st/ 347
METRIC RANK
17.1%
CHILD POVERTY UNDER THE AGE OF 5
58.9/ 100
METRIC RATING
171st/ 347
METRIC RANK
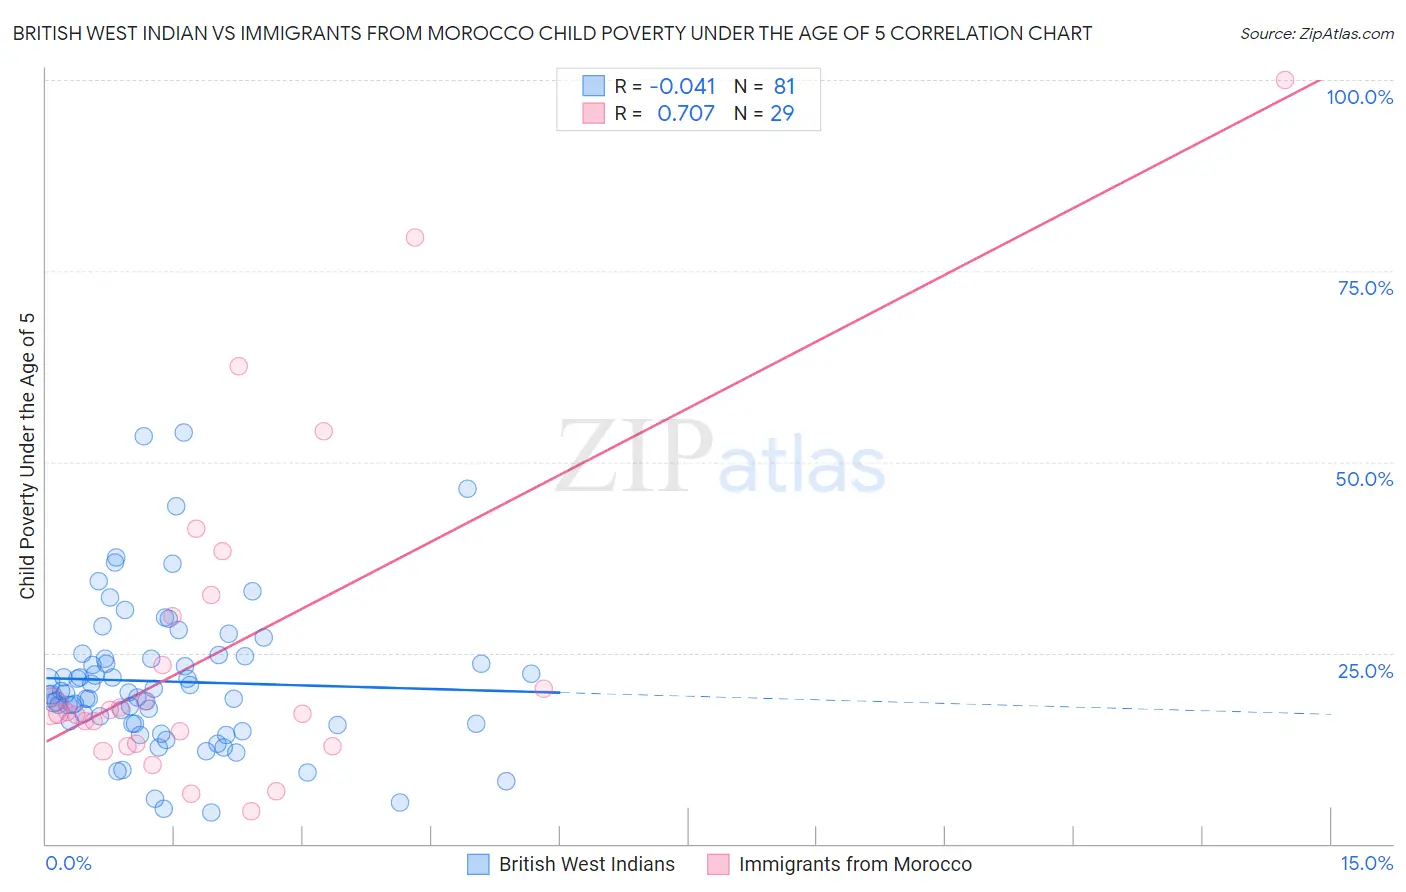
British West Indian vs Immigrants from Morocco Child Poverty Under the Age of 5 Correlation Chart
The statistical analysis conducted on geographies consisting of 150,575,514 people shows no correlation between the proportion of British West Indians and poverty level among children under the age of 5 in the United States with a correlation coefficient (R) of -0.041 and weighted average of 21.4%. Similarly, the statistical analysis conducted on geographies consisting of 175,526,639 people shows a strong positive correlation between the proportion of Immigrants from Morocco and poverty level among children under the age of 5 in the United States with a correlation coefficient (R) of 0.707 and weighted average of 17.1%, a difference of 25.5%.
Child Poverty Under the Age of 5 Correlation Summary
| Measurement | British West Indian | Immigrants from Morocco |
| Minimum | 4.1% | 4.3% |
| Maximum | 53.9% | 100.0% |
| Range | 49.8% | 95.7% |
| Mean | 21.2% | 25.8% |
| Median | 19.5% | 17.2% |
| Interquartile 25% (IQ1) | 15.7% | 13.0% |
| Interquartile 75% (IQ3) | 24.4% | 31.2% |
| Interquartile Range (IQR) | 8.7% | 18.2% |
| Standard Deviation (Sample) | 9.7% | 22.4% |
| Standard Deviation (Population) | 9.6% | 22.0% |
Similar Demographics by Child Poverty Under the Age of 5
Demographics Similar to British West Indians by Child Poverty Under the Age of 5
In terms of child poverty under the age of 5, the demographic groups most similar to British West Indians are Immigrants from Caribbean (21.4%, a difference of 0.17%), Immigrants from Haiti (21.3%, a difference of 0.58%), Immigrants from Somalia (21.6%, a difference of 0.60%), Immigrants from Senegal (21.3%, a difference of 0.65%), and Immigrants from Zaire (21.3%, a difference of 0.82%).
| Demographics | Rating | Rank | Child Poverty Under the Age of 5 |
| Somalis | 0.0 /100 | #284 | Tragic 21.1% |
| Haitians | 0.0 /100 | #285 | Tragic 21.2% |
| Immigrants | Latin America | 0.0 /100 | #286 | Tragic 21.2% |
| Immigrants | Zaire | 0.0 /100 | #287 | Tragic 21.3% |
| Immigrants | Senegal | 0.0 /100 | #288 | Tragic 21.3% |
| Immigrants | Haiti | 0.0 /100 | #289 | Tragic 21.3% |
| Immigrants | Caribbean | 0.0 /100 | #290 | Tragic 21.4% |
| British West Indians | 0.0 /100 | #291 | Tragic 21.4% |
| Immigrants | Somalia | 0.0 /100 | #292 | Tragic 21.6% |
| Mexicans | 0.0 /100 | #293 | Tragic 21.6% |
| Guatemalans | 0.0 /100 | #294 | Tragic 21.6% |
| Cherokee | 0.0 /100 | #295 | Tragic 21.7% |
| Yaqui | 0.0 /100 | #296 | Tragic 21.7% |
| Hispanics or Latinos | 0.0 /100 | #297 | Tragic 21.7% |
| Blackfeet | 0.0 /100 | #298 | Tragic 21.8% |
Demographics Similar to Immigrants from Morocco by Child Poverty Under the Age of 5
In terms of child poverty under the age of 5, the demographic groups most similar to Immigrants from Morocco are Immigrants from Western Asia (17.1%, a difference of 0.030%), Immigrants from South America (17.1%, a difference of 0.12%), Uruguayan (17.0%, a difference of 0.17%), Immigrants from Uzbekistan (17.0%, a difference of 0.33%), and Yugoslavian (17.2%, a difference of 0.51%).
| Demographics | Rating | Rank | Child Poverty Under the Age of 5 |
| Immigrants | Oceania | 67.6 /100 | #164 | Good 16.9% |
| Immigrants | Colombia | 66.9 /100 | #165 | Good 16.9% |
| Slavs | 64.0 /100 | #166 | Good 17.0% |
| Immigrants | Uzbekistan | 62.0 /100 | #167 | Good 17.0% |
| Uruguayans | 60.5 /100 | #168 | Good 17.0% |
| Immigrants | South America | 60.0 /100 | #169 | Good 17.1% |
| Immigrants | Western Asia | 59.2 /100 | #170 | Average 17.1% |
| Immigrants | Morocco | 58.9 /100 | #171 | Average 17.1% |
| Yugoslavians | 54.1 /100 | #172 | Average 17.2% |
| Welsh | 54.0 /100 | #173 | Average 17.2% |
| Immigrants | Saudi Arabia | 50.0 /100 | #174 | Average 17.2% |
| Immigrants | Lebanon | 47.6 /100 | #175 | Average 17.3% |
| Immigrants | Iraq | 45.2 /100 | #176 | Average 17.3% |
| Immigrants | Sierra Leone | 43.6 /100 | #177 | Average 17.3% |
| Immigrants | Cameroon | 42.7 /100 | #178 | Average 17.4% |