British West Indian vs Laotian Associate's Degree
COMPARE
British West Indian
Laotian
Associate's Degree
Associate's Degree Comparison
British West Indians
Laotians
42.4%
ASSOCIATE'S DEGREE
1.0/ 100
METRIC RATING
241st/ 347
METRIC RANK
49.9%
ASSOCIATE'S DEGREE
98.4/ 100
METRIC RATING
94th/ 347
METRIC RANK
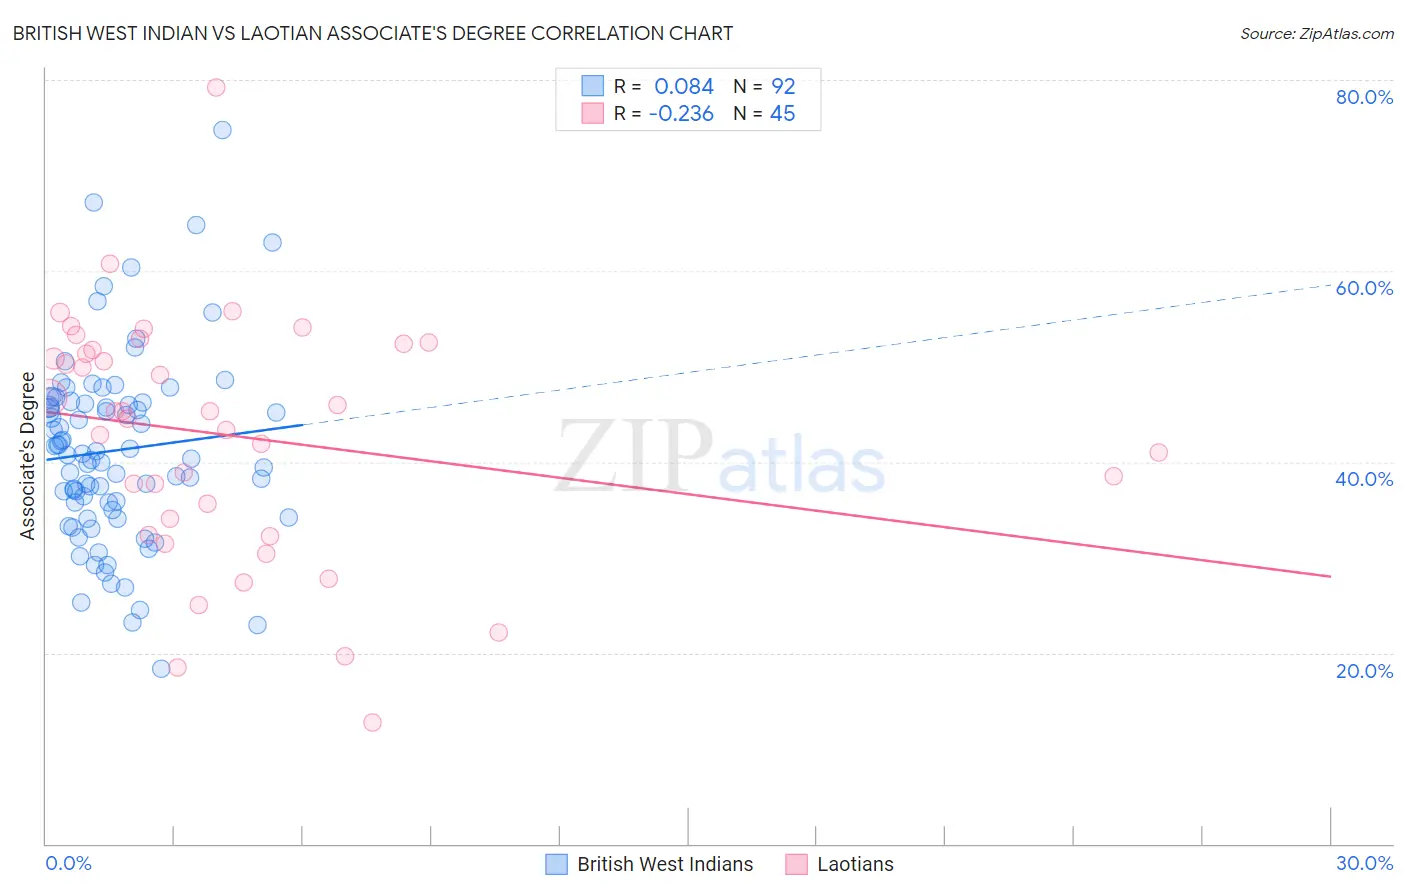
British West Indian vs Laotian Associate's Degree Correlation Chart
The statistical analysis conducted on geographies consisting of 152,683,655 people shows a slight positive correlation between the proportion of British West Indians and percentage of population with at least associate's degree education in the United States with a correlation coefficient (R) of 0.084 and weighted average of 42.4%. Similarly, the statistical analysis conducted on geographies consisting of 224,847,979 people shows a weak negative correlation between the proportion of Laotians and percentage of population with at least associate's degree education in the United States with a correlation coefficient (R) of -0.236 and weighted average of 49.9%, a difference of 17.8%.
Associate's Degree Correlation Summary
| Measurement | British West Indian | Laotian |
| Minimum | 18.3% | 12.7% |
| Maximum | 74.7% | 79.2% |
| Range | 56.4% | 66.5% |
| Mean | 41.2% | 42.7% |
| Median | 40.8% | 45.3% |
| Interquartile 25% (IQ1) | 35.3% | 33.2% |
| Interquartile 75% (IQ3) | 46.2% | 52.1% |
| Interquartile Range (IQR) | 10.9% | 18.9% |
| Standard Deviation (Sample) | 9.9% | 12.8% |
| Standard Deviation (Population) | 9.8% | 12.6% |
Similar Demographics by Associate's Degree
Demographics Similar to British West Indians by Associate's Degree
In terms of associate's degree, the demographic groups most similar to British West Indians are Immigrants from West Indies (42.4%, a difference of 0.010%), Guyanese (42.3%, a difference of 0.12%), Immigrants from Liberia (42.3%, a difference of 0.26%), Immigrants from Cambodia (42.3%, a difference of 0.28%), and Delaware (42.3%, a difference of 0.31%).
| Demographics | Rating | Rank | Associate's Degree |
| Tlingit-Haida | 2.1 /100 | #234 | Tragic 43.0% |
| Ecuadorians | 2.0 /100 | #235 | Tragic 43.0% |
| Immigrants | St. Vincent and the Grenadines | 1.9 /100 | #236 | Tragic 42.9% |
| Immigrants | Nonimmigrants | 1.9 /100 | #237 | Tragic 42.9% |
| Iroquois | 1.7 /100 | #238 | Tragic 42.8% |
| Immigrants | Grenada | 1.3 /100 | #239 | Tragic 42.6% |
| Cree | 1.2 /100 | #240 | Tragic 42.5% |
| British West Indians | 1.0 /100 | #241 | Tragic 42.4% |
| Immigrants | West Indies | 1.0 /100 | #242 | Tragic 42.4% |
| Guyanese | 1.0 /100 | #243 | Tragic 42.3% |
| Immigrants | Liberia | 0.9 /100 | #244 | Tragic 42.3% |
| Immigrants | Cambodia | 0.9 /100 | #245 | Tragic 42.3% |
| Delaware | 0.9 /100 | #246 | Tragic 42.3% |
| Immigrants | Fiji | 0.8 /100 | #247 | Tragic 42.2% |
| Immigrants | Ecuador | 0.8 /100 | #248 | Tragic 42.2% |
Demographics Similar to Laotians by Associate's Degree
In terms of associate's degree, the demographic groups most similar to Laotians are Immigrants from Brazil (50.0%, a difference of 0.13%), Immigrants from North America (50.1%, a difference of 0.28%), Immigrants from Western Asia (50.1%, a difference of 0.31%), Immigrants from Western Europe (50.1%, a difference of 0.39%), and Immigrants from Ethiopia (50.1%, a difference of 0.39%).
| Demographics | Rating | Rank | Associate's Degree |
| Immigrants | Moldova | 98.8 /100 | #87 | Exceptional 50.2% |
| Immigrants | Canada | 98.7 /100 | #88 | Exceptional 50.1% |
| Immigrants | Western Europe | 98.7 /100 | #89 | Exceptional 50.1% |
| Immigrants | Ethiopia | 98.7 /100 | #90 | Exceptional 50.1% |
| Immigrants | Western Asia | 98.7 /100 | #91 | Exceptional 50.1% |
| Immigrants | North America | 98.7 /100 | #92 | Exceptional 50.1% |
| Immigrants | Brazil | 98.5 /100 | #93 | Exceptional 50.0% |
| Laotians | 98.4 /100 | #94 | Exceptional 49.9% |
| Immigrants | England | 98.0 /100 | #95 | Exceptional 49.7% |
| Romanians | 98.0 /100 | #96 | Exceptional 49.7% |
| Immigrants | Ukraine | 98.0 /100 | #97 | Exceptional 49.7% |
| Immigrants | Northern Africa | 97.9 /100 | #98 | Exceptional 49.7% |
| Macedonians | 97.8 /100 | #99 | Exceptional 49.6% |
| Immigrants | Nepal | 97.5 /100 | #100 | Exceptional 49.5% |
| Northern Europeans | 97.3 /100 | #101 | Exceptional 49.5% |