Immigrants from Mexico vs Laotian Child Poverty Under the Age of 5
COMPARE
Immigrants from Mexico
Laotian
Child Poverty Under the Age of 5
Child Poverty Under the Age of 5 Comparison
Immigrants from Mexico
Laotians
22.2%
CHILD POVERTY UNDER THE AGE OF 5
0.0/ 100
METRIC RATING
305th/ 347
METRIC RANK
14.7%
CHILD POVERTY UNDER THE AGE OF 5
99.6/ 100
METRIC RATING
45th/ 347
METRIC RANK
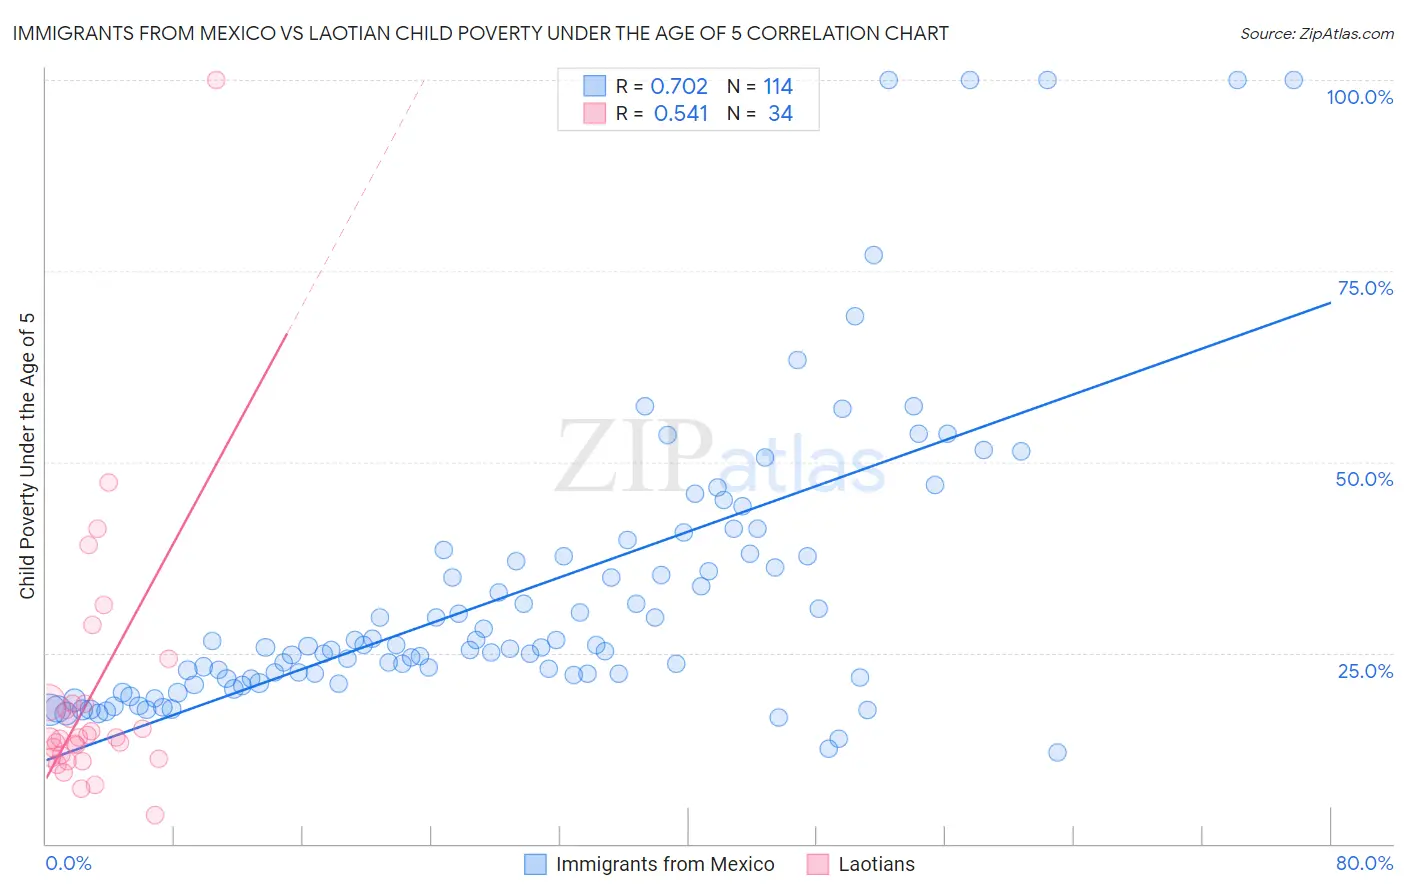
Immigrants from Mexico vs Laotian Child Poverty Under the Age of 5 Correlation Chart
The statistical analysis conducted on geographies consisting of 489,190,038 people shows a strong positive correlation between the proportion of Immigrants from Mexico and poverty level among children under the age of 5 in the United States with a correlation coefficient (R) of 0.702 and weighted average of 22.2%. Similarly, the statistical analysis conducted on geographies consisting of 219,686,525 people shows a substantial positive correlation between the proportion of Laotians and poverty level among children under the age of 5 in the United States with a correlation coefficient (R) of 0.541 and weighted average of 14.7%, a difference of 51.0%.
Child Poverty Under the Age of 5 Correlation Summary
| Measurement | Immigrants from Mexico | Laotian |
| Minimum | 11.9% | 3.8% |
| Maximum | 100.0% | 100.0% |
| Range | 88.1% | 96.2% |
| Mean | 32.8% | 19.4% |
| Median | 25.8% | 13.8% |
| Interquartile 25% (IQ1) | 21.7% | 11.3% |
| Interquartile 75% (IQ3) | 37.6% | 18.3% |
| Interquartile Range (IQR) | 16.0% | 7.0% |
| Standard Deviation (Sample) | 19.1% | 17.3% |
| Standard Deviation (Population) | 19.0% | 17.0% |
Similar Demographics by Child Poverty Under the Age of 5
Demographics Similar to Immigrants from Mexico by Child Poverty Under the Age of 5
In terms of child poverty under the age of 5, the demographic groups most similar to Immigrants from Mexico are Indonesian (22.3%, a difference of 0.060%), Immigrants from Guatemala (22.0%, a difference of 0.87%), Inupiat (22.0%, a difference of 0.98%), Iroquois (22.0%, a difference of 1.1%), and Immigrants from Central America (22.0%, a difference of 1.2%).
| Demographics | Rating | Rank | Child Poverty Under the Age of 5 |
| Blackfeet | 0.0 /100 | #298 | Tragic 21.8% |
| Chickasaw | 0.0 /100 | #299 | Tragic 21.8% |
| Alaskan Athabascans | 0.0 /100 | #300 | Tragic 21.8% |
| Immigrants | Central America | 0.0 /100 | #301 | Tragic 22.0% |
| Iroquois | 0.0 /100 | #302 | Tragic 22.0% |
| Inupiat | 0.0 /100 | #303 | Tragic 22.0% |
| Immigrants | Guatemala | 0.0 /100 | #304 | Tragic 22.0% |
| Immigrants | Mexico | 0.0 /100 | #305 | Tragic 22.2% |
| Indonesians | 0.0 /100 | #306 | Tragic 22.3% |
| Immigrants | Bahamas | 0.0 /100 | #307 | Tragic 22.7% |
| Immigrants | Dominica | 0.0 /100 | #308 | Tragic 22.7% |
| Houma | 0.0 /100 | #309 | Tragic 22.7% |
| Africans | 0.0 /100 | #310 | Tragic 22.8% |
| Seminole | 0.0 /100 | #311 | Tragic 22.8% |
| Hondurans | 0.0 /100 | #312 | Tragic 23.0% |
Demographics Similar to Laotians by Child Poverty Under the Age of 5
In terms of child poverty under the age of 5, the demographic groups most similar to Laotians are Tsimshian (14.7%, a difference of 0.080%), Immigrants from Philippines (14.7%, a difference of 0.13%), Russian (14.8%, a difference of 0.21%), Soviet Union (14.7%, a difference of 0.26%), and Immigrants from Greece (14.7%, a difference of 0.26%).
| Demographics | Rating | Rank | Child Poverty Under the Age of 5 |
| Eastern Europeans | 99.7 /100 | #38 | Exceptional 14.6% |
| Norwegians | 99.7 /100 | #39 | Exceptional 14.6% |
| Immigrants | Australia | 99.7 /100 | #40 | Exceptional 14.6% |
| Immigrants | Belarus | 99.7 /100 | #41 | Exceptional 14.7% |
| Soviet Union | 99.7 /100 | #42 | Exceptional 14.7% |
| Immigrants | Greece | 99.7 /100 | #43 | Exceptional 14.7% |
| Immigrants | Philippines | 99.7 /100 | #44 | Exceptional 14.7% |
| Laotians | 99.6 /100 | #45 | Exceptional 14.7% |
| Tsimshian | 99.6 /100 | #46 | Exceptional 14.7% |
| Russians | 99.6 /100 | #47 | Exceptional 14.8% |
| Immigrants | Czechoslovakia | 99.6 /100 | #48 | Exceptional 14.8% |
| Immigrants | Bulgaria | 99.6 /100 | #49 | Exceptional 14.8% |
| Immigrants | Northern Europe | 99.6 /100 | #50 | Exceptional 14.8% |
| Estonians | 99.6 /100 | #51 | Exceptional 14.8% |
| Immigrants | Serbia | 99.5 /100 | #52 | Exceptional 14.9% |