British West Indian vs Immigrants from Europe Child Poverty Under the Age of 5
COMPARE
British West Indian
Immigrants from Europe
Child Poverty Under the Age of 5
Child Poverty Under the Age of 5 Comparison
British West Indians
Immigrants from Europe
21.4%
CHILD POVERTY UNDER THE AGE OF 5
0.0/ 100
METRIC RATING
291st/ 347
METRIC RANK
15.1%
CHILD POVERTY UNDER THE AGE OF 5
99.1/ 100
METRIC RATING
63rd/ 347
METRIC RANK
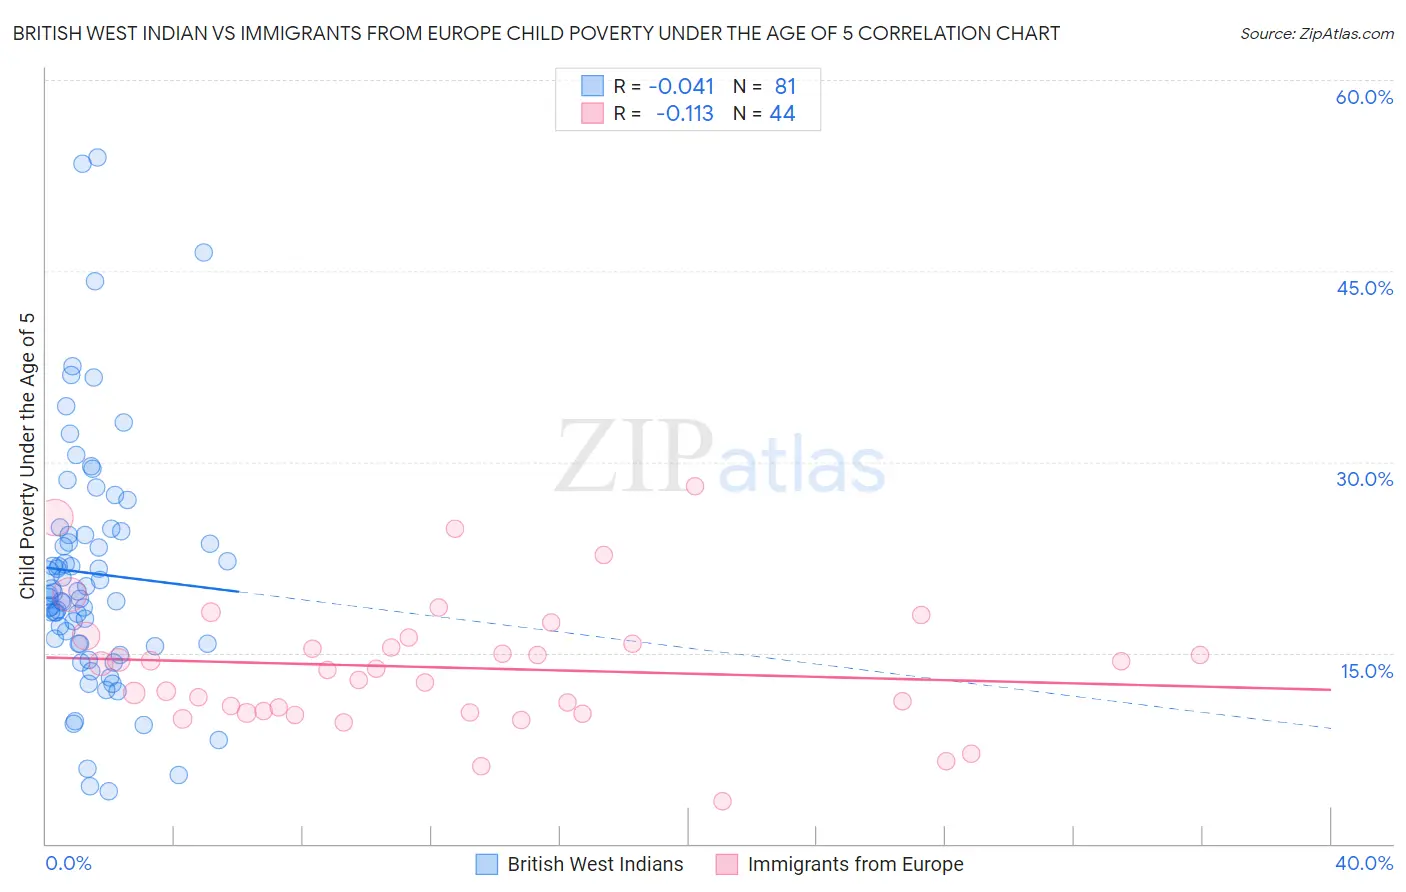
British West Indian vs Immigrants from Europe Child Poverty Under the Age of 5 Correlation Chart
The statistical analysis conducted on geographies consisting of 150,575,514 people shows no correlation between the proportion of British West Indians and poverty level among children under the age of 5 in the United States with a correlation coefficient (R) of -0.041 and weighted average of 21.4%. Similarly, the statistical analysis conducted on geographies consisting of 511,883,823 people shows a poor negative correlation between the proportion of Immigrants from Europe and poverty level among children under the age of 5 in the United States with a correlation coefficient (R) of -0.113 and weighted average of 15.1%, a difference of 41.4%.
Child Poverty Under the Age of 5 Correlation Summary
| Measurement | British West Indian | Immigrants from Europe |
| Minimum | 4.1% | 3.3% |
| Maximum | 53.9% | 28.1% |
| Range | 49.8% | 24.7% |
| Mean | 21.2% | 13.8% |
| Median | 19.5% | 13.7% |
| Interquartile 25% (IQ1) | 15.7% | 10.4% |
| Interquartile 75% (IQ3) | 24.4% | 16.0% |
| Interquartile Range (IQR) | 8.7% | 5.6% |
| Standard Deviation (Sample) | 9.7% | 5.1% |
| Standard Deviation (Population) | 9.6% | 5.0% |
Similar Demographics by Child Poverty Under the Age of 5
Demographics Similar to British West Indians by Child Poverty Under the Age of 5
In terms of child poverty under the age of 5, the demographic groups most similar to British West Indians are Immigrants from Caribbean (21.4%, a difference of 0.17%), Immigrants from Haiti (21.3%, a difference of 0.58%), Immigrants from Somalia (21.6%, a difference of 0.60%), Immigrants from Senegal (21.3%, a difference of 0.65%), and Immigrants from Zaire (21.3%, a difference of 0.82%).
| Demographics | Rating | Rank | Child Poverty Under the Age of 5 |
| Somalis | 0.0 /100 | #284 | Tragic 21.1% |
| Haitians | 0.0 /100 | #285 | Tragic 21.2% |
| Immigrants | Latin America | 0.0 /100 | #286 | Tragic 21.2% |
| Immigrants | Zaire | 0.0 /100 | #287 | Tragic 21.3% |
| Immigrants | Senegal | 0.0 /100 | #288 | Tragic 21.3% |
| Immigrants | Haiti | 0.0 /100 | #289 | Tragic 21.3% |
| Immigrants | Caribbean | 0.0 /100 | #290 | Tragic 21.4% |
| British West Indians | 0.0 /100 | #291 | Tragic 21.4% |
| Immigrants | Somalia | 0.0 /100 | #292 | Tragic 21.6% |
| Mexicans | 0.0 /100 | #293 | Tragic 21.6% |
| Guatemalans | 0.0 /100 | #294 | Tragic 21.6% |
| Cherokee | 0.0 /100 | #295 | Tragic 21.7% |
| Yaqui | 0.0 /100 | #296 | Tragic 21.7% |
| Hispanics or Latinos | 0.0 /100 | #297 | Tragic 21.7% |
| Blackfeet | 0.0 /100 | #298 | Tragic 21.8% |
Demographics Similar to Immigrants from Europe by Child Poverty Under the Age of 5
In terms of child poverty under the age of 5, the demographic groups most similar to Immigrants from Europe are Immigrants from Romania (15.2%, a difference of 0.020%), Immigrants from Fiji (15.2%, a difference of 0.050%), Immigrants from Eastern Europe (15.1%, a difference of 0.13%), Immigrants from Scotland (15.2%, a difference of 0.16%), and Greek (15.2%, a difference of 0.23%).
| Demographics | Rating | Rank | Child Poverty Under the Age of 5 |
| Immigrants | Pakistan | 99.4 /100 | #56 | Exceptional 14.9% |
| Egyptians | 99.4 /100 | #57 | Exceptional 14.9% |
| Swedes | 99.4 /100 | #58 | Exceptional 15.0% |
| Paraguayans | 99.4 /100 | #59 | Exceptional 15.0% |
| Immigrants | Russia | 99.3 /100 | #60 | Exceptional 15.0% |
| Immigrants | Poland | 99.1 /100 | #61 | Exceptional 15.1% |
| Immigrants | Eastern Europe | 99.1 /100 | #62 | Exceptional 15.1% |
| Immigrants | Europe | 99.1 /100 | #63 | Exceptional 15.1% |
| Immigrants | Romania | 99.1 /100 | #64 | Exceptional 15.2% |
| Immigrants | Fiji | 99.0 /100 | #65 | Exceptional 15.2% |
| Immigrants | Scotland | 99.0 /100 | #66 | Exceptional 15.2% |
| Greeks | 99.0 /100 | #67 | Exceptional 15.2% |
| Zimbabweans | 99.0 /100 | #68 | Exceptional 15.2% |
| Lithuanians | 99.0 /100 | #69 | Exceptional 15.2% |
| Immigrants | Belgium | 98.8 /100 | #70 | Exceptional 15.3% |