British West Indian vs Immigrants from Argentina Child Poverty Under the Age of 5
COMPARE
British West Indian
Immigrants from Argentina
Child Poverty Under the Age of 5
Child Poverty Under the Age of 5 Comparison
British West Indians
Immigrants from Argentina
21.4%
CHILD POVERTY UNDER THE AGE OF 5
0.0/ 100
METRIC RATING
291st/ 347
METRIC RANK
15.4%
CHILD POVERTY UNDER THE AGE OF 5
98.5/ 100
METRIC RATING
75th/ 347
METRIC RANK
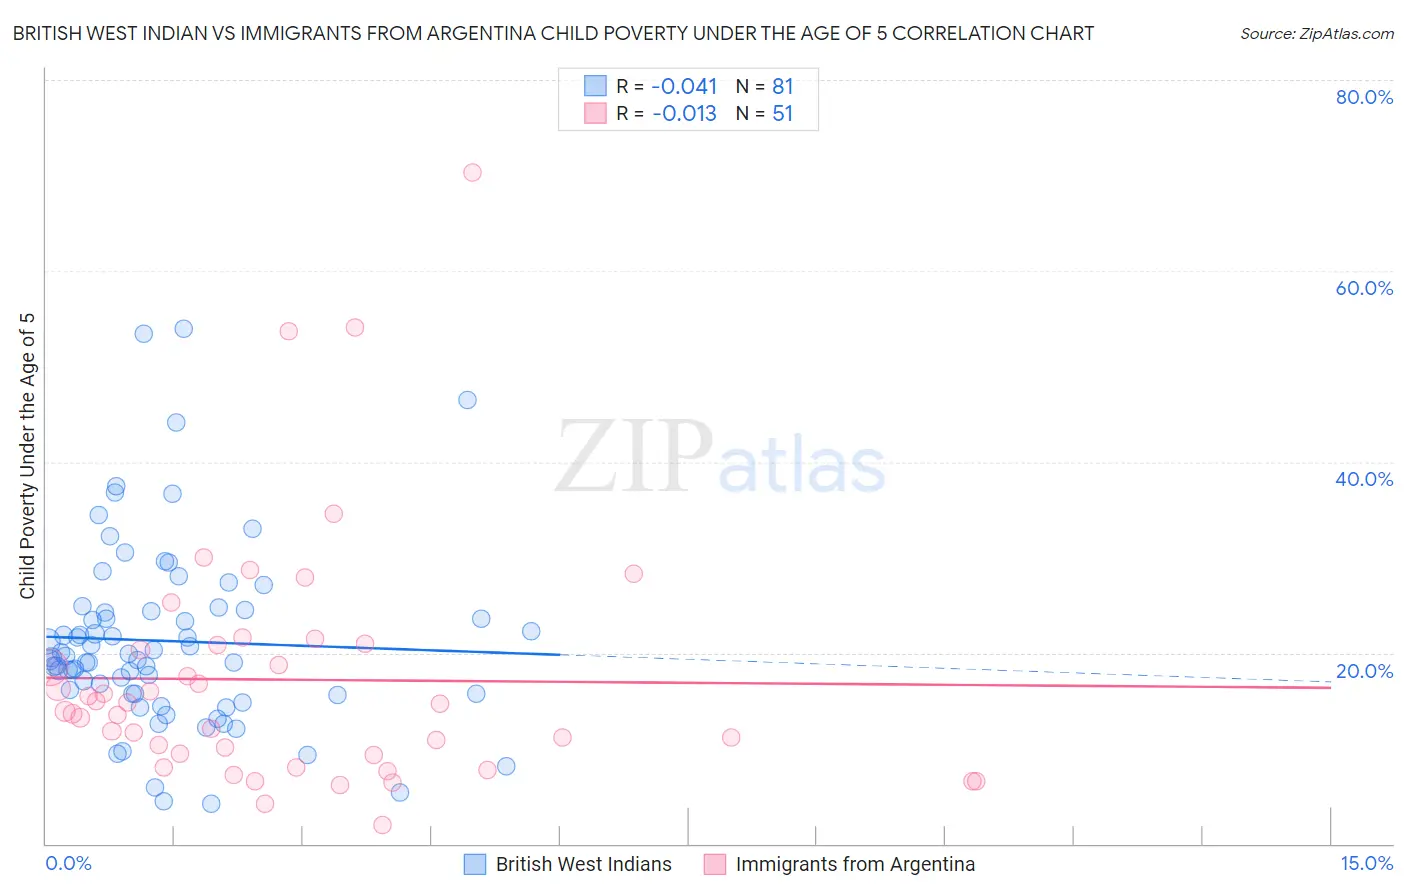
British West Indian vs Immigrants from Argentina Child Poverty Under the Age of 5 Correlation Chart
The statistical analysis conducted on geographies consisting of 150,575,514 people shows no correlation between the proportion of British West Indians and poverty level among children under the age of 5 in the United States with a correlation coefficient (R) of -0.041 and weighted average of 21.4%. Similarly, the statistical analysis conducted on geographies consisting of 256,145,971 people shows no correlation between the proportion of Immigrants from Argentina and poverty level among children under the age of 5 in the United States with a correlation coefficient (R) of -0.013 and weighted average of 15.4%, a difference of 39.4%.
Child Poverty Under the Age of 5 Correlation Summary
| Measurement | British West Indian | Immigrants from Argentina |
| Minimum | 4.1% | 2.0% |
| Maximum | 53.9% | 70.4% |
| Range | 49.8% | 68.4% |
| Mean | 21.2% | 17.2% |
| Median | 19.5% | 13.9% |
| Interquartile 25% (IQ1) | 15.7% | 9.3% |
| Interquartile 75% (IQ3) | 24.4% | 20.8% |
| Interquartile Range (IQR) | 8.7% | 11.5% |
| Standard Deviation (Sample) | 9.7% | 13.0% |
| Standard Deviation (Population) | 9.6% | 12.9% |
Similar Demographics by Child Poverty Under the Age of 5
Demographics Similar to British West Indians by Child Poverty Under the Age of 5
In terms of child poverty under the age of 5, the demographic groups most similar to British West Indians are Immigrants from Caribbean (21.4%, a difference of 0.17%), Immigrants from Haiti (21.3%, a difference of 0.58%), Immigrants from Somalia (21.6%, a difference of 0.60%), Immigrants from Senegal (21.3%, a difference of 0.65%), and Immigrants from Zaire (21.3%, a difference of 0.82%).
| Demographics | Rating | Rank | Child Poverty Under the Age of 5 |
| Somalis | 0.0 /100 | #284 | Tragic 21.1% |
| Haitians | 0.0 /100 | #285 | Tragic 21.2% |
| Immigrants | Latin America | 0.0 /100 | #286 | Tragic 21.2% |
| Immigrants | Zaire | 0.0 /100 | #287 | Tragic 21.3% |
| Immigrants | Senegal | 0.0 /100 | #288 | Tragic 21.3% |
| Immigrants | Haiti | 0.0 /100 | #289 | Tragic 21.3% |
| Immigrants | Caribbean | 0.0 /100 | #290 | Tragic 21.4% |
| British West Indians | 0.0 /100 | #291 | Tragic 21.4% |
| Immigrants | Somalia | 0.0 /100 | #292 | Tragic 21.6% |
| Mexicans | 0.0 /100 | #293 | Tragic 21.6% |
| Guatemalans | 0.0 /100 | #294 | Tragic 21.6% |
| Cherokee | 0.0 /100 | #295 | Tragic 21.7% |
| Yaqui | 0.0 /100 | #296 | Tragic 21.7% |
| Hispanics or Latinos | 0.0 /100 | #297 | Tragic 21.7% |
| Blackfeet | 0.0 /100 | #298 | Tragic 21.8% |
Demographics Similar to Immigrants from Argentina by Child Poverty Under the Age of 5
In terms of child poverty under the age of 5, the demographic groups most similar to Immigrants from Argentina are Croatian (15.4%, a difference of 0.0%), Argentinean (15.4%, a difference of 0.15%), Immigrants from Turkey (15.4%, a difference of 0.21%), Immigrants from Ukraine (15.3%, a difference of 0.51%), and Sri Lankan (15.5%, a difference of 0.54%).
| Demographics | Rating | Rank | Child Poverty Under the Age of 5 |
| Zimbabweans | 99.0 /100 | #68 | Exceptional 15.2% |
| Lithuanians | 99.0 /100 | #69 | Exceptional 15.2% |
| Immigrants | Belgium | 98.8 /100 | #70 | Exceptional 15.3% |
| Immigrants | Egypt | 98.8 /100 | #71 | Exceptional 15.3% |
| Immigrants | Sweden | 98.8 /100 | #72 | Exceptional 15.3% |
| Immigrants | Ukraine | 98.7 /100 | #73 | Exceptional 15.3% |
| Argentineans | 98.5 /100 | #74 | Exceptional 15.4% |
| Immigrants | Argentina | 98.5 /100 | #75 | Exceptional 15.4% |
| Croatians | 98.5 /100 | #76 | Exceptional 15.4% |
| Immigrants | Turkey | 98.3 /100 | #77 | Exceptional 15.4% |
| Sri Lankans | 98.1 /100 | #78 | Exceptional 15.5% |
| Australians | 98.0 /100 | #79 | Exceptional 15.5% |
| Italians | 97.9 /100 | #80 | Exceptional 15.5% |
| Czechs | 97.8 /100 | #81 | Exceptional 15.5% |
| Immigrants | Italy | 97.7 /100 | #82 | Exceptional 15.6% |