British West Indian vs German Child Poverty Under the Age of 5
COMPARE
British West Indian
German
Child Poverty Under the Age of 5
Child Poverty Under the Age of 5 Comparison
British West Indians
Germans
21.4%
CHILD POVERTY UNDER THE AGE OF 5
0.0/ 100
METRIC RATING
291st/ 347
METRIC RANK
16.5%
CHILD POVERTY UNDER THE AGE OF 5
84.8/ 100
METRIC RATING
138th/ 347
METRIC RANK
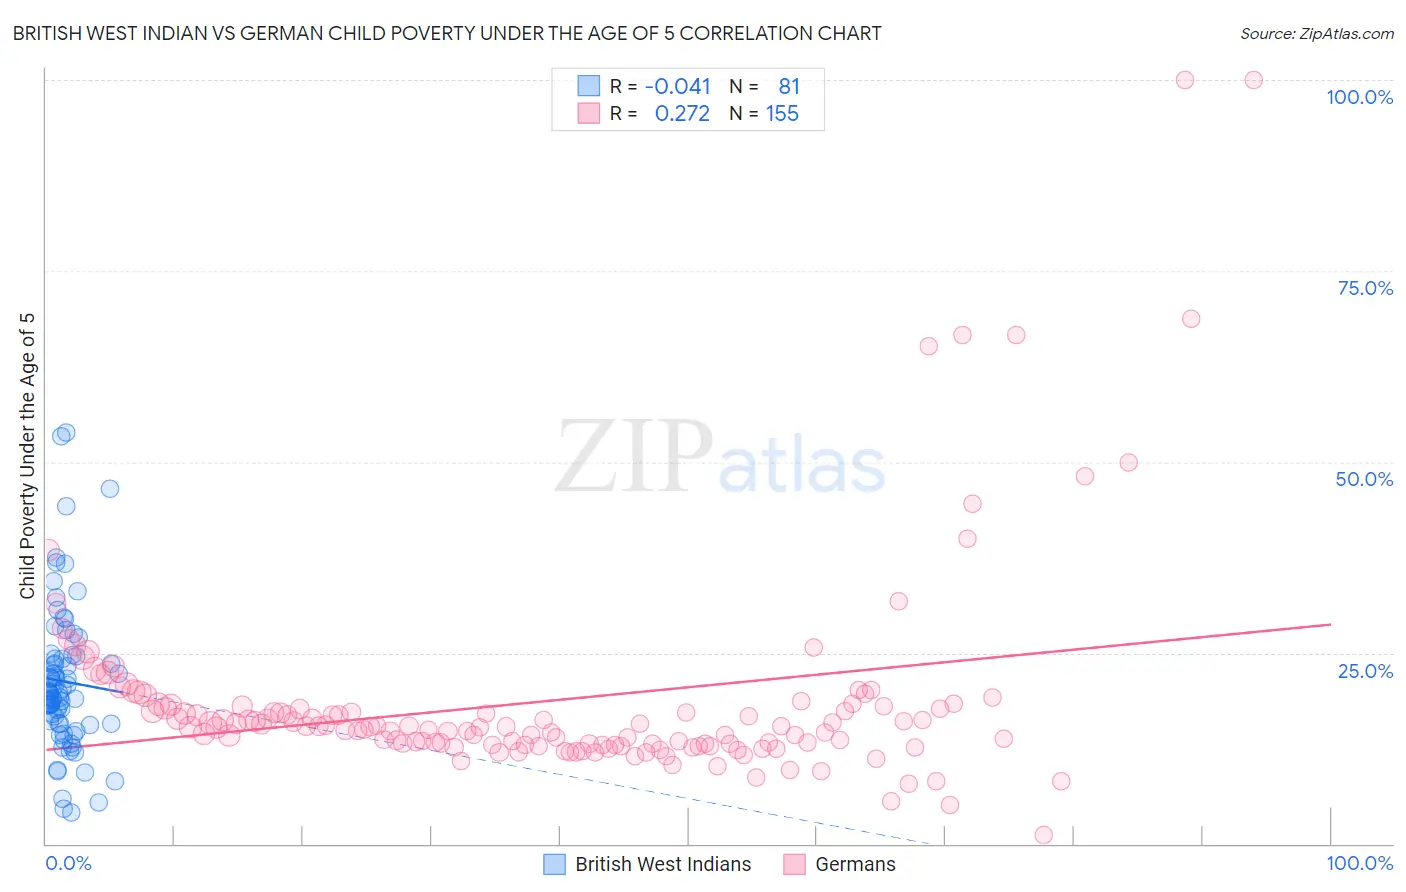
British West Indian vs German Child Poverty Under the Age of 5 Correlation Chart
The statistical analysis conducted on geographies consisting of 150,575,514 people shows no correlation between the proportion of British West Indians and poverty level among children under the age of 5 in the United States with a correlation coefficient (R) of -0.041 and weighted average of 21.4%. Similarly, the statistical analysis conducted on geographies consisting of 537,099,242 people shows a weak positive correlation between the proportion of Germans and poverty level among children under the age of 5 in the United States with a correlation coefficient (R) of 0.272 and weighted average of 16.5%, a difference of 30.1%.
Child Poverty Under the Age of 5 Correlation Summary
| Measurement | British West Indian | German |
| Minimum | 4.1% | 1.1% |
| Maximum | 53.9% | 100.0% |
| Range | 49.8% | 98.9% |
| Mean | 21.2% | 18.7% |
| Median | 19.5% | 15.3% |
| Interquartile 25% (IQ1) | 15.7% | 13.0% |
| Interquartile 75% (IQ3) | 24.4% | 18.0% |
| Interquartile Range (IQR) | 8.7% | 5.0% |
| Standard Deviation (Sample) | 9.7% | 14.0% |
| Standard Deviation (Population) | 9.6% | 14.0% |
Similar Demographics by Child Poverty Under the Age of 5
Demographics Similar to British West Indians by Child Poverty Under the Age of 5
In terms of child poverty under the age of 5, the demographic groups most similar to British West Indians are Immigrants from Caribbean (21.4%, a difference of 0.17%), Immigrants from Haiti (21.3%, a difference of 0.58%), Immigrants from Somalia (21.6%, a difference of 0.60%), Immigrants from Senegal (21.3%, a difference of 0.65%), and Immigrants from Zaire (21.3%, a difference of 0.82%).
| Demographics | Rating | Rank | Child Poverty Under the Age of 5 |
| Somalis | 0.0 /100 | #284 | Tragic 21.1% |
| Haitians | 0.0 /100 | #285 | Tragic 21.2% |
| Immigrants | Latin America | 0.0 /100 | #286 | Tragic 21.2% |
| Immigrants | Zaire | 0.0 /100 | #287 | Tragic 21.3% |
| Immigrants | Senegal | 0.0 /100 | #288 | Tragic 21.3% |
| Immigrants | Haiti | 0.0 /100 | #289 | Tragic 21.3% |
| Immigrants | Caribbean | 0.0 /100 | #290 | Tragic 21.4% |
| British West Indians | 0.0 /100 | #291 | Tragic 21.4% |
| Immigrants | Somalia | 0.0 /100 | #292 | Tragic 21.6% |
| Mexicans | 0.0 /100 | #293 | Tragic 21.6% |
| Guatemalans | 0.0 /100 | #294 | Tragic 21.6% |
| Cherokee | 0.0 /100 | #295 | Tragic 21.7% |
| Yaqui | 0.0 /100 | #296 | Tragic 21.7% |
| Hispanics or Latinos | 0.0 /100 | #297 | Tragic 21.7% |
| Blackfeet | 0.0 /100 | #298 | Tragic 21.8% |
Demographics Similar to Germans by Child Poverty Under the Age of 5
In terms of child poverty under the age of 5, the demographic groups most similar to Germans are Immigrants from Hungary (16.5%, a difference of 0.060%), Immigrants from Chile (16.4%, a difference of 0.10%), Guamanian/Chamorro (16.5%, a difference of 0.13%), Immigrants from Western Europe (16.5%, a difference of 0.32%), and Portuguese (16.5%, a difference of 0.36%).
| Demographics | Rating | Rank | Child Poverty Under the Age of 5 |
| Finns | 88.3 /100 | #131 | Excellent 16.3% |
| Serbians | 88.2 /100 | #132 | Excellent 16.3% |
| Icelanders | 87.9 /100 | #133 | Excellent 16.3% |
| Immigrants | North Macedonia | 87.8 /100 | #134 | Excellent 16.4% |
| Brazilians | 87.8 /100 | #135 | Excellent 16.4% |
| Immigrants | Northern Africa | 87.5 /100 | #136 | Excellent 16.4% |
| Immigrants | Chile | 85.3 /100 | #137 | Excellent 16.4% |
| Germans | 84.8 /100 | #138 | Excellent 16.5% |
| Immigrants | Hungary | 84.5 /100 | #139 | Excellent 16.5% |
| Guamanians/Chamorros | 84.2 /100 | #140 | Excellent 16.5% |
| Immigrants | Western Europe | 83.3 /100 | #141 | Excellent 16.5% |
| Portuguese | 83.0 /100 | #142 | Excellent 16.5% |
| Samoans | 83.0 /100 | #143 | Excellent 16.5% |
| Ethiopians | 82.7 /100 | #144 | Excellent 16.5% |
| Immigrants | Ethiopia | 82.1 /100 | #145 | Excellent 16.6% |