Yuman vs Laotian Child Poverty Under the Age of 5
COMPARE
Yuman
Laotian
Child Poverty Under the Age of 5
Child Poverty Under the Age of 5 Comparison
Yuman
Laotians
29.5%
CHILD POVERTY UNDER THE AGE OF 5
0.0/ 100
METRIC RATING
343rd/ 347
METRIC RANK
14.7%
CHILD POVERTY UNDER THE AGE OF 5
99.6/ 100
METRIC RATING
45th/ 347
METRIC RANK
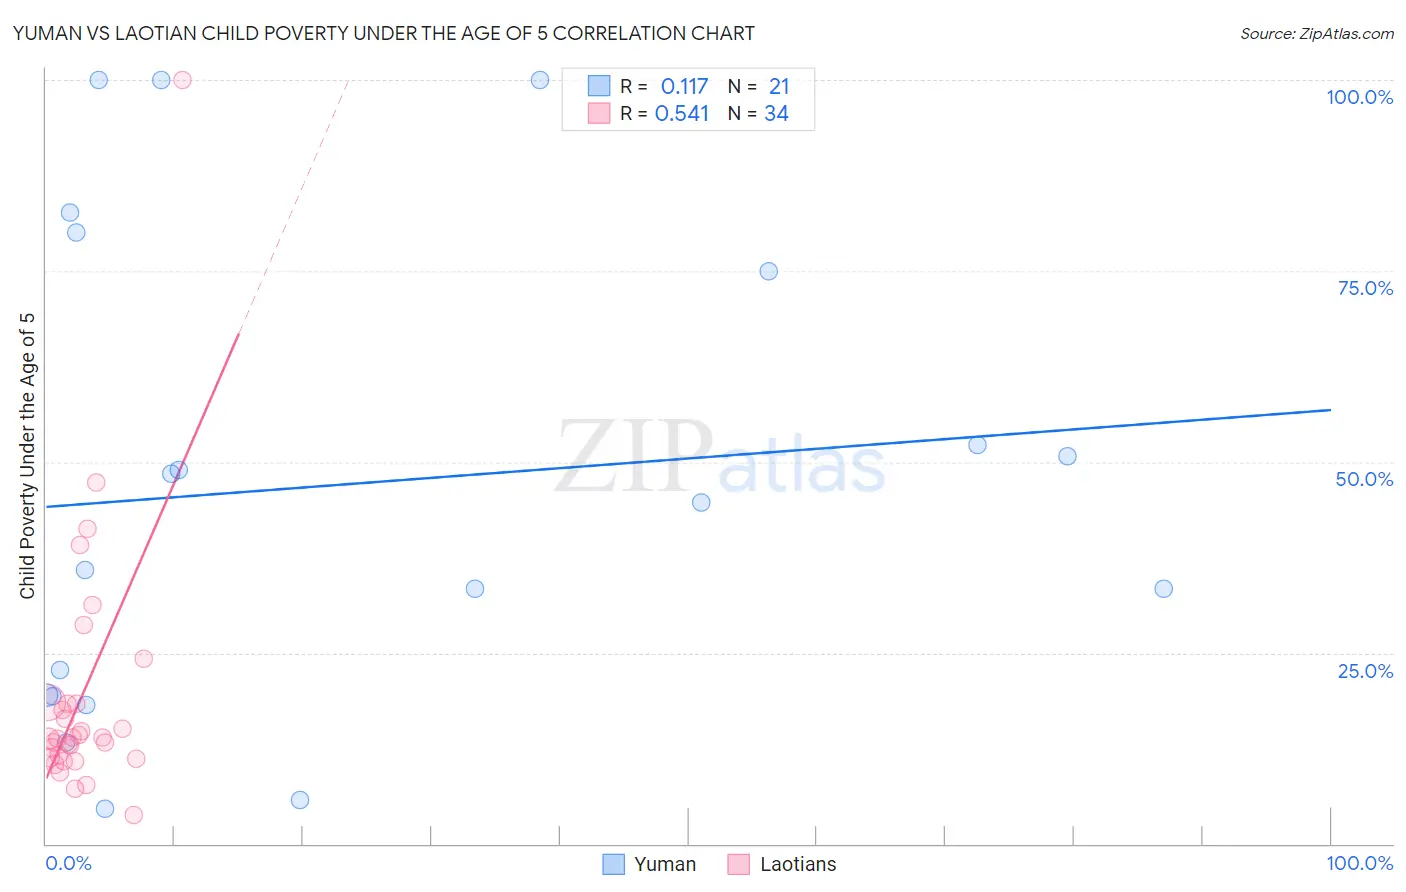
Yuman vs Laotian Child Poverty Under the Age of 5 Correlation Chart
The statistical analysis conducted on geographies consisting of 40,515,033 people shows a poor positive correlation between the proportion of Yuman and poverty level among children under the age of 5 in the United States with a correlation coefficient (R) of 0.117 and weighted average of 29.5%. Similarly, the statistical analysis conducted on geographies consisting of 219,686,525 people shows a substantial positive correlation between the proportion of Laotians and poverty level among children under the age of 5 in the United States with a correlation coefficient (R) of 0.541 and weighted average of 14.7%, a difference of 100.7%.
Child Poverty Under the Age of 5 Correlation Summary
| Measurement | Yuman | Laotian |
| Minimum | 4.6% | 3.8% |
| Maximum | 100.0% | 100.0% |
| Range | 95.4% | 96.2% |
| Mean | 47.1% | 19.4% |
| Median | 44.7% | 13.8% |
| Interquartile 25% (IQ1) | 19.4% | 11.3% |
| Interquartile 75% (IQ3) | 77.5% | 18.3% |
| Interquartile Range (IQR) | 58.1% | 7.0% |
| Standard Deviation (Sample) | 31.4% | 17.3% |
| Standard Deviation (Population) | 30.6% | 17.0% |
Similar Demographics by Child Poverty Under the Age of 5
Demographics Similar to Yuman by Child Poverty Under the Age of 5
In terms of child poverty under the age of 5, the demographic groups most similar to Yuman are Tohono O'odham (29.5%, a difference of 0.16%), Immigrants from Yemen (29.3%, a difference of 0.84%), Cheyenne (28.3%, a difference of 4.3%), Crow (31.0%, a difference of 4.9%), and Yup'ik (27.7%, a difference of 6.6%).
| Demographics | Rating | Rank | Child Poverty Under the Age of 5 |
| Natives/Alaskans | 0.0 /100 | #333 | Tragic 25.6% |
| Blacks/African Americans | 0.0 /100 | #334 | Tragic 25.7% |
| Colville | 0.0 /100 | #335 | Tragic 25.7% |
| Sioux | 0.0 /100 | #336 | Tragic 26.9% |
| Pima | 0.0 /100 | #337 | Tragic 27.4% |
| Hopi | 0.0 /100 | #338 | Tragic 27.7% |
| Yup'ik | 0.0 /100 | #339 | Tragic 27.7% |
| Cheyenne | 0.0 /100 | #340 | Tragic 28.3% |
| Immigrants | Yemen | 0.0 /100 | #341 | Tragic 29.3% |
| Tohono O'odham | 0.0 /100 | #342 | Tragic 29.5% |
| Yuman | 0.0 /100 | #343 | Tragic 29.5% |
| Crow | 0.0 /100 | #344 | Tragic 31.0% |
| Navajo | 0.0 /100 | #345 | Tragic 31.6% |
| Lumbee | 0.0 /100 | #346 | Tragic 33.3% |
| Puerto Ricans | 0.0 /100 | #347 | Tragic 34.5% |
Demographics Similar to Laotians by Child Poverty Under the Age of 5
In terms of child poverty under the age of 5, the demographic groups most similar to Laotians are Tsimshian (14.7%, a difference of 0.080%), Immigrants from Philippines (14.7%, a difference of 0.13%), Russian (14.8%, a difference of 0.21%), Soviet Union (14.7%, a difference of 0.26%), and Immigrants from Greece (14.7%, a difference of 0.26%).
| Demographics | Rating | Rank | Child Poverty Under the Age of 5 |
| Eastern Europeans | 99.7 /100 | #38 | Exceptional 14.6% |
| Norwegians | 99.7 /100 | #39 | Exceptional 14.6% |
| Immigrants | Australia | 99.7 /100 | #40 | Exceptional 14.6% |
| Immigrants | Belarus | 99.7 /100 | #41 | Exceptional 14.7% |
| Soviet Union | 99.7 /100 | #42 | Exceptional 14.7% |
| Immigrants | Greece | 99.7 /100 | #43 | Exceptional 14.7% |
| Immigrants | Philippines | 99.7 /100 | #44 | Exceptional 14.7% |
| Laotians | 99.6 /100 | #45 | Exceptional 14.7% |
| Tsimshian | 99.6 /100 | #46 | Exceptional 14.7% |
| Russians | 99.6 /100 | #47 | Exceptional 14.8% |
| Immigrants | Czechoslovakia | 99.6 /100 | #48 | Exceptional 14.8% |
| Immigrants | Bulgaria | 99.6 /100 | #49 | Exceptional 14.8% |
| Immigrants | Northern Europe | 99.6 /100 | #50 | Exceptional 14.8% |
| Estonians | 99.6 /100 | #51 | Exceptional 14.8% |
| Immigrants | Serbia | 99.5 /100 | #52 | Exceptional 14.9% |