British West Indian vs Seminole Child Poverty Under the Age of 5
COMPARE
British West Indian
Seminole
Child Poverty Under the Age of 5
Child Poverty Under the Age of 5 Comparison
British West Indians
Seminole
21.4%
CHILD POVERTY UNDER THE AGE OF 5
0.0/ 100
METRIC RATING
291st/ 347
METRIC RANK
22.8%
CHILD POVERTY UNDER THE AGE OF 5
0.0/ 100
METRIC RATING
311th/ 347
METRIC RANK
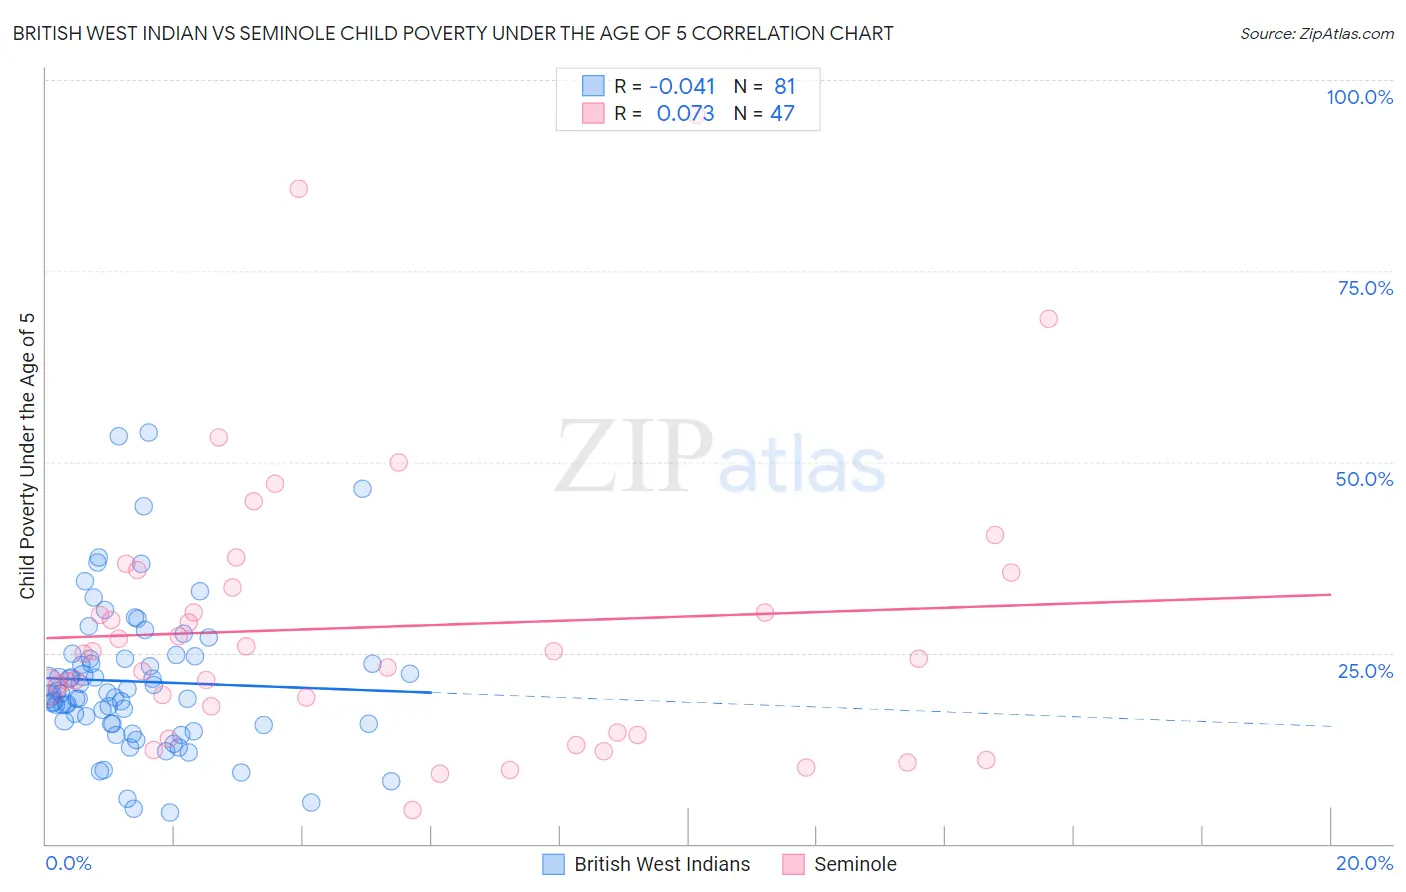
British West Indian vs Seminole Child Poverty Under the Age of 5 Correlation Chart
The statistical analysis conducted on geographies consisting of 150,575,514 people shows no correlation between the proportion of British West Indians and poverty level among children under the age of 5 in the United States with a correlation coefficient (R) of -0.041 and weighted average of 21.4%. Similarly, the statistical analysis conducted on geographies consisting of 117,328,756 people shows a slight positive correlation between the proportion of Seminole and poverty level among children under the age of 5 in the United States with a correlation coefficient (R) of 0.073 and weighted average of 22.8%, a difference of 6.5%.
Child Poverty Under the Age of 5 Correlation Summary
| Measurement | British West Indian | Seminole |
| Minimum | 4.1% | 4.3% |
| Maximum | 53.9% | 95.5% |
| Range | 49.8% | 91.1% |
| Mean | 21.2% | 28.4% |
| Median | 19.5% | 24.9% |
| Interquartile 25% (IQ1) | 15.7% | 14.6% |
| Interquartile 75% (IQ3) | 24.4% | 35.5% |
| Interquartile Range (IQR) | 8.7% | 20.9% |
| Standard Deviation (Sample) | 9.7% | 18.6% |
| Standard Deviation (Population) | 9.6% | 18.4% |
Demographics Similar to British West Indians and Seminole by Child Poverty Under the Age of 5
In terms of child poverty under the age of 5, the demographic groups most similar to British West Indians are Immigrants from Somalia (21.6%, a difference of 0.60%), Mexican (21.6%, a difference of 0.88%), Guatemalan (21.6%, a difference of 1.0%), Cherokee (21.7%, a difference of 1.3%), and Yaqui (21.7%, a difference of 1.4%). Similarly, the demographic groups most similar to Seminole are African (22.8%, a difference of 0.050%), Houma (22.7%, a difference of 0.45%), Immigrants from Dominica (22.7%, a difference of 0.59%), Immigrants from Bahamas (22.7%, a difference of 0.63%), and Indonesian (22.3%, a difference of 2.6%).
| Demographics | Rating | Rank | Child Poverty Under the Age of 5 |
| British West Indians | 0.0 /100 | #291 | Tragic 21.4% |
| Immigrants | Somalia | 0.0 /100 | #292 | Tragic 21.6% |
| Mexicans | 0.0 /100 | #293 | Tragic 21.6% |
| Guatemalans | 0.0 /100 | #294 | Tragic 21.6% |
| Cherokee | 0.0 /100 | #295 | Tragic 21.7% |
| Yaqui | 0.0 /100 | #296 | Tragic 21.7% |
| Hispanics or Latinos | 0.0 /100 | #297 | Tragic 21.7% |
| Blackfeet | 0.0 /100 | #298 | Tragic 21.8% |
| Chickasaw | 0.0 /100 | #299 | Tragic 21.8% |
| Alaskan Athabascans | 0.0 /100 | #300 | Tragic 21.8% |
| Immigrants | Central America | 0.0 /100 | #301 | Tragic 22.0% |
| Iroquois | 0.0 /100 | #302 | Tragic 22.0% |
| Inupiat | 0.0 /100 | #303 | Tragic 22.0% |
| Immigrants | Guatemala | 0.0 /100 | #304 | Tragic 22.0% |
| Immigrants | Mexico | 0.0 /100 | #305 | Tragic 22.2% |
| Indonesians | 0.0 /100 | #306 | Tragic 22.3% |
| Immigrants | Bahamas | 0.0 /100 | #307 | Tragic 22.7% |
| Immigrants | Dominica | 0.0 /100 | #308 | Tragic 22.7% |
| Houma | 0.0 /100 | #309 | Tragic 22.7% |
| Africans | 0.0 /100 | #310 | Tragic 22.8% |
| Seminole | 0.0 /100 | #311 | Tragic 22.8% |