British West Indian vs Apache 11th Grade
COMPARE
British West Indian
Apache
11th Grade
11th Grade Comparison
British West Indians
Apache
90.3%
11TH GRADE
0.0/ 100
METRIC RATING
289th/ 347
METRIC RANK
90.4%
11TH GRADE
0.0/ 100
METRIC RATING
287th/ 347
METRIC RANK
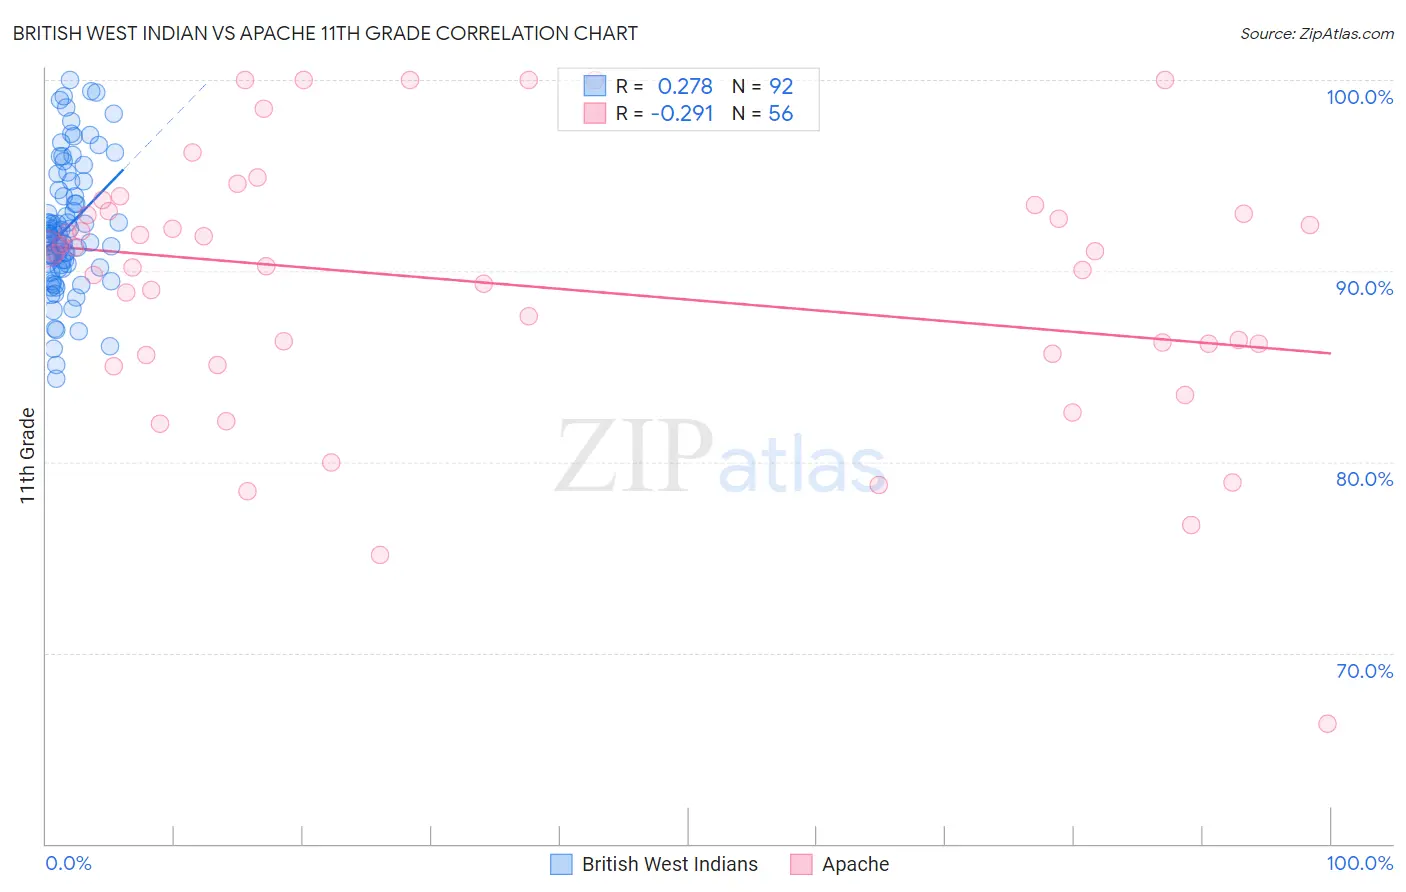
British West Indian vs Apache 11th Grade Correlation Chart
The statistical analysis conducted on geographies consisting of 152,691,173 people shows a weak positive correlation between the proportion of British West Indians and percentage of population with at least 11th grade education in the United States with a correlation coefficient (R) of 0.278 and weighted average of 90.3%. Similarly, the statistical analysis conducted on geographies consisting of 231,143,094 people shows a weak negative correlation between the proportion of Apache and percentage of population with at least 11th grade education in the United States with a correlation coefficient (R) of -0.291 and weighted average of 90.4%, a difference of 0.050%.
11th Grade Correlation Summary
| Measurement | British West Indian | Apache |
| Minimum | 84.4% | 66.3% |
| Maximum | 100.0% | 100.0% |
| Range | 15.6% | 33.7% |
| Mean | 92.3% | 89.2% |
| Median | 91.9% | 90.6% |
| Interquartile 25% (IQ1) | 90.2% | 85.6% |
| Interquartile 75% (IQ3) | 94.4% | 93.1% |
| Interquartile Range (IQR) | 4.2% | 7.4% |
| Standard Deviation (Sample) | 3.4% | 7.0% |
| Standard Deviation (Population) | 3.4% | 6.9% |
Demographics Similar to British West Indians and Apache by 11th Grade
In terms of 11th grade, the demographic groups most similar to British West Indians are Pennsylvania German (90.3%, a difference of 0.020%), Indonesian (90.3%, a difference of 0.020%), Immigrants from West Indies (90.4%, a difference of 0.050%), Haitian (90.3%, a difference of 0.060%), and Cuban (90.2%, a difference of 0.090%). Similarly, the demographic groups most similar to Apache are Immigrants from West Indies (90.4%, a difference of 0.010%), Pennsylvania German (90.3%, a difference of 0.020%), Immigrants from Burma/Myanmar (90.4%, a difference of 0.060%), Indonesian (90.3%, a difference of 0.070%), and Haitian (90.3%, a difference of 0.11%).
| Demographics | Rating | Rank | 11th Grade |
| Malaysians | 0.1 /100 | #278 | Tragic 90.8% |
| Barbadians | 0.0 /100 | #279 | Tragic 90.8% |
| Sri Lankans | 0.0 /100 | #280 | Tragic 90.7% |
| Dutch West Indians | 0.0 /100 | #281 | Tragic 90.7% |
| Immigrants | St. Vincent and the Grenadines | 0.0 /100 | #282 | Tragic 90.7% |
| Immigrants | Barbados | 0.0 /100 | #283 | Tragic 90.7% |
| Immigrants | Laos | 0.0 /100 | #284 | Tragic 90.5% |
| Immigrants | Burma/Myanmar | 0.0 /100 | #285 | Tragic 90.4% |
| Immigrants | West Indies | 0.0 /100 | #286 | Tragic 90.4% |
| Apache | 0.0 /100 | #287 | Tragic 90.4% |
| Pennsylvania Germans | 0.0 /100 | #288 | Tragic 90.3% |
| British West Indians | 0.0 /100 | #289 | Tragic 90.3% |
| Indonesians | 0.0 /100 | #290 | Tragic 90.3% |
| Haitians | 0.0 /100 | #291 | Tragic 90.3% |
| Cubans | 0.0 /100 | #292 | Tragic 90.2% |
| Natives/Alaskans | 0.0 /100 | #293 | Tragic 90.2% |
| Immigrants | Grenada | 0.0 /100 | #294 | Tragic 90.1% |
| Immigrants | Vietnam | 0.0 /100 | #295 | Tragic 90.0% |
| Fijians | 0.0 /100 | #296 | Tragic 90.0% |
| Navajo | 0.0 /100 | #297 | Tragic 90.0% |
| Immigrants | Fiji | 0.0 /100 | #298 | Tragic 89.9% |