British West Indian vs Navajo Male Poverty
COMPARE
British West Indian
Navajo
Male Poverty
Male Poverty Comparison
British West Indians
Navajo
14.6%
MALE POVERTY
0.0/ 100
METRIC RATING
316th/ 347
METRIC RANK
22.3%
MALE POVERTY
0.0/ 100
METRIC RATING
346th/ 347
METRIC RANK
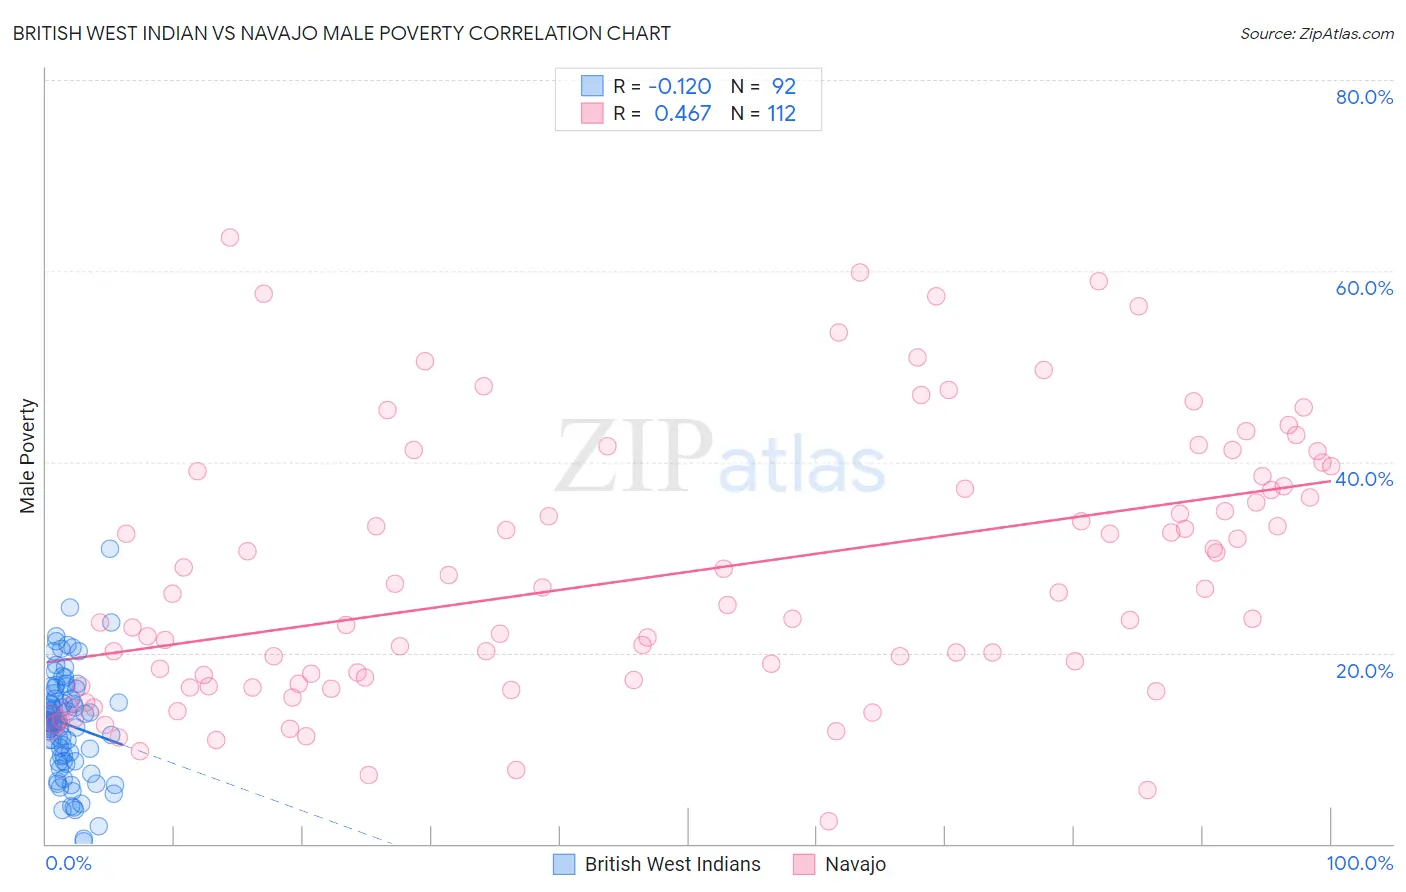
British West Indian vs Navajo Male Poverty Correlation Chart
The statistical analysis conducted on geographies consisting of 152,618,428 people shows a poor negative correlation between the proportion of British West Indians and poverty level among males in the United States with a correlation coefficient (R) of -0.120 and weighted average of 14.6%. Similarly, the statistical analysis conducted on geographies consisting of 224,713,606 people shows a moderate positive correlation between the proportion of Navajo and poverty level among males in the United States with a correlation coefficient (R) of 0.467 and weighted average of 22.3%, a difference of 52.8%.
Male Poverty Correlation Summary
| Measurement | British West Indian | Navajo |
| Minimum | 0.21% | 2.3% |
| Maximum | 30.9% | 63.5% |
| Range | 30.7% | 61.2% |
| Mean | 12.5% | 28.1% |
| Median | 12.7% | 25.6% |
| Interquartile 25% (IQ1) | 8.9% | 16.6% |
| Interquartile 75% (IQ3) | 15.5% | 38.0% |
| Interquartile Range (IQR) | 6.6% | 21.4% |
| Standard Deviation (Sample) | 5.5% | 13.9% |
| Standard Deviation (Population) | 5.5% | 13.9% |
Similar Demographics by Male Poverty
Demographics Similar to British West Indians by Male Poverty
In terms of male poverty, the demographic groups most similar to British West Indians are Chippewa (14.6%, a difference of 0.020%), Immigrants from Honduras (14.6%, a difference of 0.10%), Immigrants from Somalia (14.6%, a difference of 0.14%), Immigrants from Dominica (14.7%, a difference of 0.68%), and Immigrants from Grenada (14.7%, a difference of 0.74%).
| Demographics | Rating | Rank | Male Poverty |
| Somalis | 0.0 /100 | #309 | Tragic 14.3% |
| Seminole | 0.0 /100 | #310 | Tragic 14.3% |
| Hondurans | 0.0 /100 | #311 | Tragic 14.3% |
| Choctaw | 0.0 /100 | #312 | Tragic 14.4% |
| Immigrants | Somalia | 0.0 /100 | #313 | Tragic 14.6% |
| Immigrants | Honduras | 0.0 /100 | #314 | Tragic 14.6% |
| Chippewa | 0.0 /100 | #315 | Tragic 14.6% |
| British West Indians | 0.0 /100 | #316 | Tragic 14.6% |
| Immigrants | Dominica | 0.0 /100 | #317 | Tragic 14.7% |
| Immigrants | Grenada | 0.0 /100 | #318 | Tragic 14.7% |
| U.S. Virgin Islanders | 0.0 /100 | #319 | Tragic 14.7% |
| Immigrants | Congo | 0.0 /100 | #320 | Tragic 14.7% |
| Arapaho | 0.0 /100 | #321 | Tragic 15.1% |
| Kiowa | 0.0 /100 | #322 | Tragic 15.2% |
| Colville | 0.0 /100 | #323 | Tragic 15.2% |
Demographics Similar to Navajo by Male Poverty
In terms of male poverty, the demographic groups most similar to Navajo are Puerto Rican (22.0%, a difference of 1.3%), Tohono O'odham (22.9%, a difference of 2.6%), Hopi (20.8%, a difference of 7.2%), Yup'ik (20.4%, a difference of 9.4%), and Pima (20.4%, a difference of 9.6%).
| Demographics | Rating | Rank | Male Poverty |
| Natives/Alaskans | 0.0 /100 | #333 | Tragic 16.9% |
| Cheyenne | 0.0 /100 | #334 | Tragic 17.6% |
| Apache | 0.0 /100 | #335 | Tragic 17.7% |
| Pueblo | 0.0 /100 | #336 | Tragic 18.5% |
| Sioux | 0.0 /100 | #337 | Tragic 18.7% |
| Crow | 0.0 /100 | #338 | Tragic 19.1% |
| Yuman | 0.0 /100 | #339 | Tragic 19.5% |
| Immigrants | Yemen | 0.0 /100 | #340 | Tragic 20.1% |
| Lumbee | 0.0 /100 | #341 | Tragic 20.2% |
| Pima | 0.0 /100 | #342 | Tragic 20.4% |
| Yup'ik | 0.0 /100 | #343 | Tragic 20.4% |
| Hopi | 0.0 /100 | #344 | Tragic 20.8% |
| Puerto Ricans | 0.0 /100 | #345 | Tragic 22.0% |
| Navajo | 0.0 /100 | #346 | Tragic 22.3% |
| Tohono O'odham | 0.0 /100 | #347 | Tragic 22.9% |