British West Indian vs Immigrants from Romania Male Poverty
COMPARE
British West Indian
Immigrants from Romania
Male Poverty
Male Poverty Comparison
British West Indians
Immigrants from Romania
14.6%
MALE POVERTY
0.0/ 100
METRIC RATING
316th/ 347
METRIC RANK
9.9%
MALE POVERTY
98.9/ 100
METRIC RATING
44th/ 347
METRIC RANK
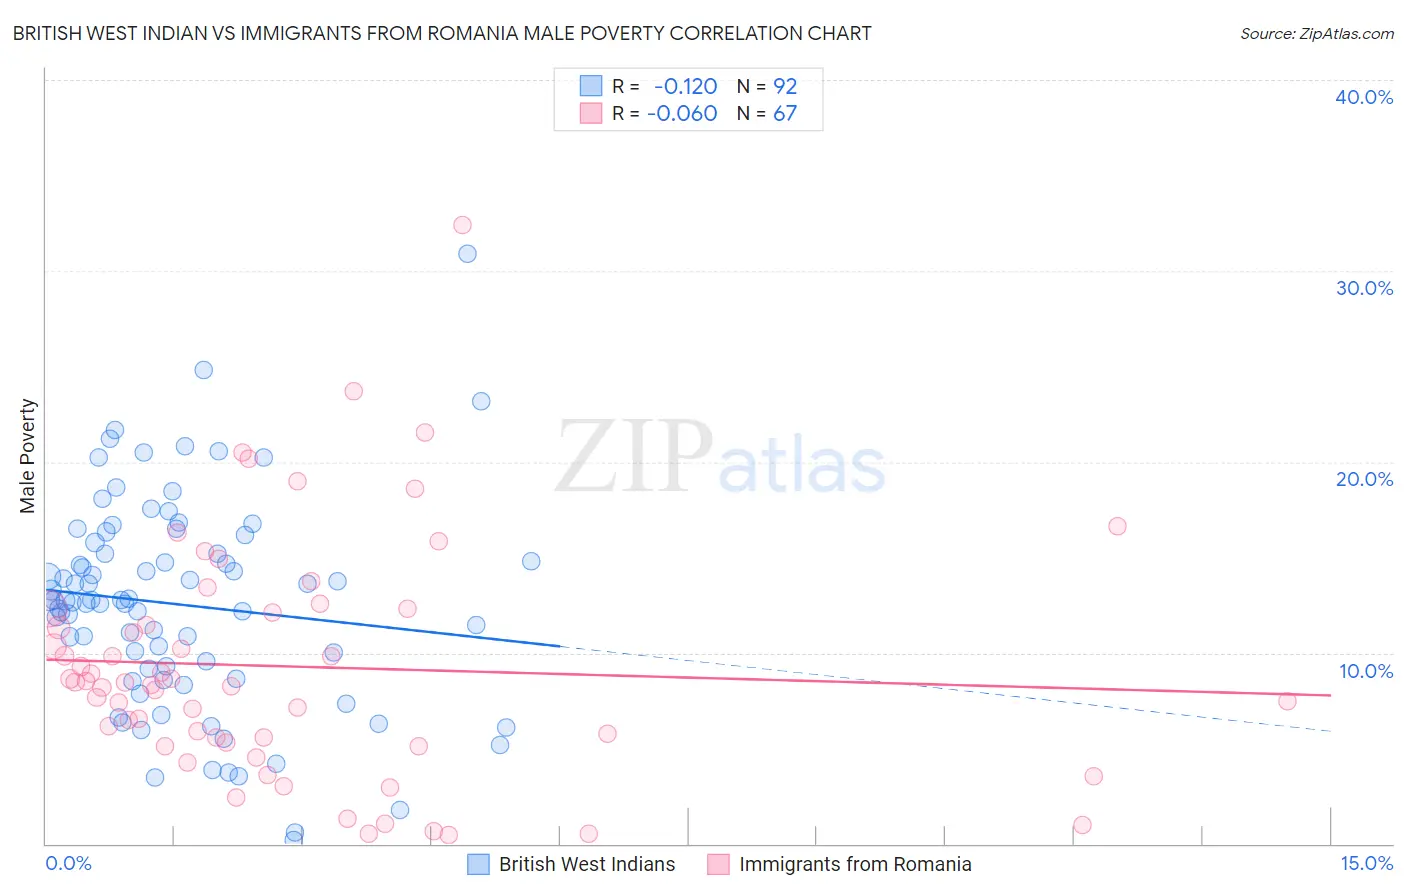
British West Indian vs Immigrants from Romania Male Poverty Correlation Chart
The statistical analysis conducted on geographies consisting of 152,618,428 people shows a poor negative correlation between the proportion of British West Indians and poverty level among males in the United States with a correlation coefficient (R) of -0.120 and weighted average of 14.6%. Similarly, the statistical analysis conducted on geographies consisting of 256,906,857 people shows a slight negative correlation between the proportion of Immigrants from Romania and poverty level among males in the United States with a correlation coefficient (R) of -0.060 and weighted average of 9.9%, a difference of 46.8%.
Male Poverty Correlation Summary
| Measurement | British West Indian | Immigrants from Romania |
| Minimum | 0.21% | 0.44% |
| Maximum | 30.9% | 32.4% |
| Range | 30.7% | 31.9% |
| Mean | 12.5% | 9.3% |
| Median | 12.7% | 8.5% |
| Interquartile 25% (IQ1) | 8.9% | 5.3% |
| Interquartile 75% (IQ3) | 15.5% | 12.3% |
| Interquartile Range (IQR) | 6.6% | 7.0% |
| Standard Deviation (Sample) | 5.5% | 6.2% |
| Standard Deviation (Population) | 5.5% | 6.1% |
Similar Demographics by Male Poverty
Demographics Similar to British West Indians by Male Poverty
In terms of male poverty, the demographic groups most similar to British West Indians are Chippewa (14.6%, a difference of 0.020%), Immigrants from Honduras (14.6%, a difference of 0.10%), Immigrants from Somalia (14.6%, a difference of 0.14%), Immigrants from Dominica (14.7%, a difference of 0.68%), and Immigrants from Grenada (14.7%, a difference of 0.74%).
| Demographics | Rating | Rank | Male Poverty |
| Somalis | 0.0 /100 | #309 | Tragic 14.3% |
| Seminole | 0.0 /100 | #310 | Tragic 14.3% |
| Hondurans | 0.0 /100 | #311 | Tragic 14.3% |
| Choctaw | 0.0 /100 | #312 | Tragic 14.4% |
| Immigrants | Somalia | 0.0 /100 | #313 | Tragic 14.6% |
| Immigrants | Honduras | 0.0 /100 | #314 | Tragic 14.6% |
| Chippewa | 0.0 /100 | #315 | Tragic 14.6% |
| British West Indians | 0.0 /100 | #316 | Tragic 14.6% |
| Immigrants | Dominica | 0.0 /100 | #317 | Tragic 14.7% |
| Immigrants | Grenada | 0.0 /100 | #318 | Tragic 14.7% |
| U.S. Virgin Islanders | 0.0 /100 | #319 | Tragic 14.7% |
| Immigrants | Congo | 0.0 /100 | #320 | Tragic 14.7% |
| Arapaho | 0.0 /100 | #321 | Tragic 15.1% |
| Kiowa | 0.0 /100 | #322 | Tragic 15.2% |
| Colville | 0.0 /100 | #323 | Tragic 15.2% |
Demographics Similar to Immigrants from Romania by Male Poverty
In terms of male poverty, the demographic groups most similar to Immigrants from Romania are Immigrants from Serbia (10.0%, a difference of 0.18%), Turkish (10.0%, a difference of 0.20%), Immigrants from Moldova (9.9%, a difference of 0.22%), Immigrants from Singapore (10.0%, a difference of 0.33%), and Immigrants from Japan (10.0%, a difference of 0.34%).
| Demographics | Rating | Rank | Male Poverty |
| Immigrants | Greece | 99.3 /100 | #37 | Exceptional 9.8% |
| Immigrants | Pakistan | 99.2 /100 | #38 | Exceptional 9.9% |
| Russians | 99.2 /100 | #39 | Exceptional 9.9% |
| Cypriots | 99.2 /100 | #40 | Exceptional 9.9% |
| Koreans | 99.2 /100 | #41 | Exceptional 9.9% |
| Immigrants | Iran | 99.1 /100 | #42 | Exceptional 9.9% |
| Immigrants | Moldova | 99.0 /100 | #43 | Exceptional 9.9% |
| Immigrants | Romania | 98.9 /100 | #44 | Exceptional 9.9% |
| Immigrants | Serbia | 98.9 /100 | #45 | Exceptional 10.0% |
| Turks | 98.9 /100 | #46 | Exceptional 10.0% |
| Immigrants | Singapore | 98.8 /100 | #47 | Exceptional 10.0% |
| Immigrants | Japan | 98.8 /100 | #48 | Exceptional 10.0% |
| Slovenes | 98.8 /100 | #49 | Exceptional 10.0% |
| Immigrants | Philippines | 98.7 /100 | #50 | Exceptional 10.0% |
| Immigrants | Croatia | 98.7 /100 | #51 | Exceptional 10.0% |