British vs Dominican Poverty
COMPARE
British
Dominican
Poverty
Poverty Comparison
British
Dominicans
11.4%
POVERTY
95.0/ 100
METRIC RATING
92nd/ 347
METRIC RANK
17.6%
POVERTY
0.0/ 100
METRIC RATING
330th/ 347
METRIC RANK
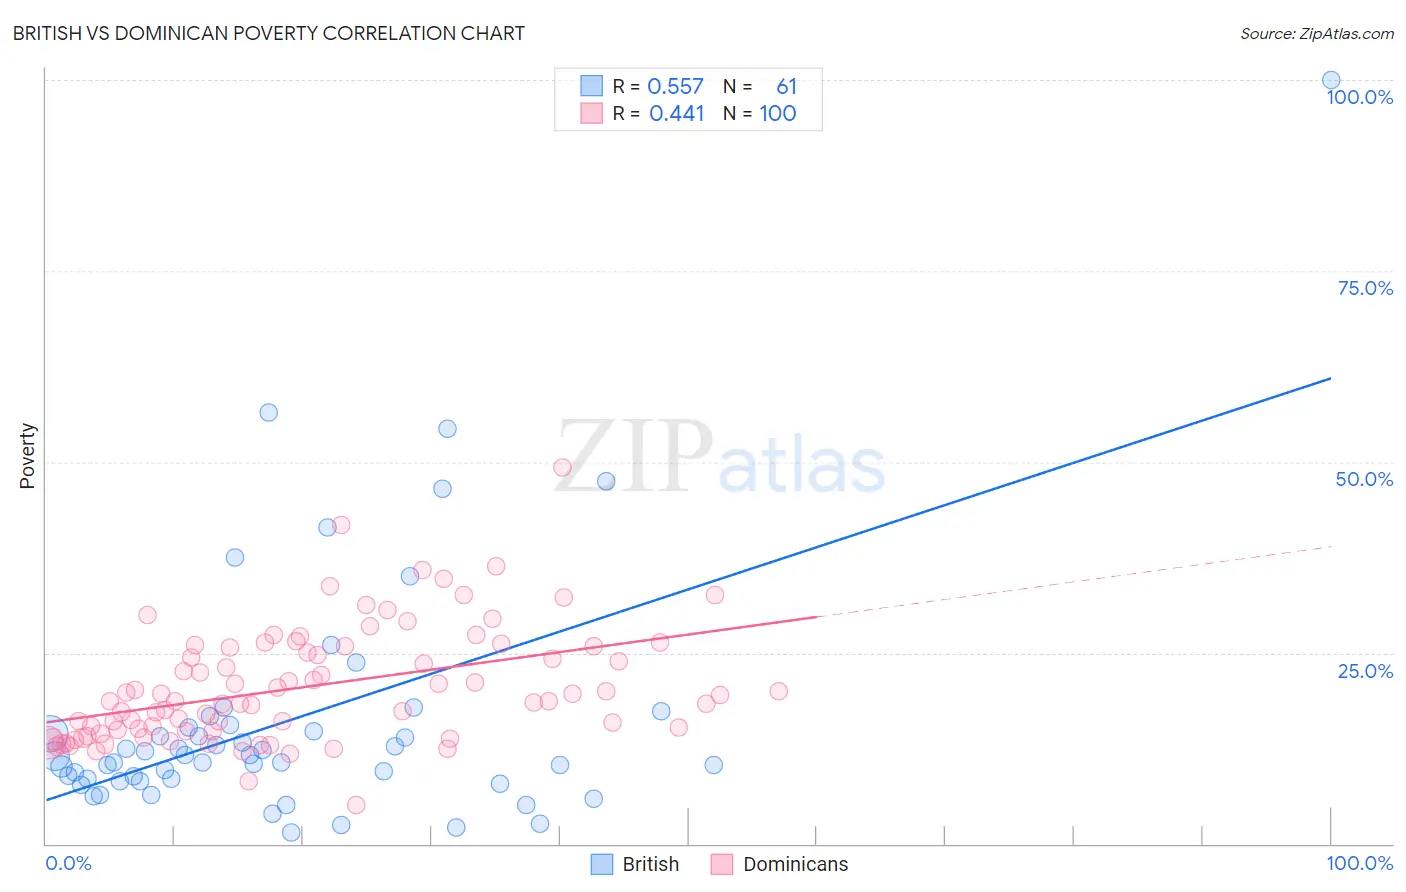
British vs Dominican Poverty Correlation Chart
The statistical analysis conducted on geographies consisting of 530,938,105 people shows a substantial positive correlation between the proportion of British and poverty level in the United States with a correlation coefficient (R) of 0.557 and weighted average of 11.4%. Similarly, the statistical analysis conducted on geographies consisting of 354,775,564 people shows a moderate positive correlation between the proportion of Dominicans and poverty level in the United States with a correlation coefficient (R) of 0.441 and weighted average of 17.6%, a difference of 54.2%.
Poverty Correlation Summary
| Measurement | British | Dominican |
| Minimum | 1.5% | 5.1% |
| Maximum | 100.0% | 49.2% |
| Range | 98.5% | 44.1% |
| Mean | 16.2% | 20.5% |
| Median | 11.4% | 18.7% |
| Interquartile 25% (IQ1) | 8.4% | 14.7% |
| Interquartile 75% (IQ3) | 15.4% | 25.7% |
| Interquartile Range (IQR) | 7.0% | 11.0% |
| Standard Deviation (Sample) | 16.5% | 7.5% |
| Standard Deviation (Population) | 16.3% | 7.5% |
Similar Demographics by Poverty
Demographics Similar to British by Poverty
In terms of poverty, the demographic groups most similar to British are Romanian (11.4%, a difference of 0.030%), Paraguayan (11.4%, a difference of 0.060%), Australian (11.4%, a difference of 0.060%), Finnish (11.4%, a difference of 0.14%), and Immigrants from South Africa (11.5%, a difference of 0.18%).
| Demographics | Rating | Rank | Poverty |
| Immigrants | England | 96.2 /100 | #85 | Exceptional 11.4% |
| Jordanians | 96.0 /100 | #86 | Exceptional 11.4% |
| Northern Europeans | 96.0 /100 | #87 | Exceptional 11.4% |
| Belgians | 95.8 /100 | #88 | Exceptional 11.4% |
| Czechoslovakians | 95.7 /100 | #89 | Exceptional 11.4% |
| Immigrants | Denmark | 95.5 /100 | #90 | Exceptional 11.4% |
| Finns | 95.2 /100 | #91 | Exceptional 11.4% |
| British | 95.0 /100 | #92 | Exceptional 11.4% |
| Romanians | 94.9 /100 | #93 | Exceptional 11.4% |
| Paraguayans | 94.9 /100 | #94 | Exceptional 11.4% |
| Australians | 94.9 /100 | #95 | Exceptional 11.4% |
| Immigrants | South Africa | 94.7 /100 | #96 | Exceptional 11.5% |
| Immigrants | Egypt | 94.6 /100 | #97 | Exceptional 11.5% |
| Immigrants | Latvia | 94.5 /100 | #98 | Exceptional 11.5% |
| Immigrants | Indonesia | 94.2 /100 | #99 | Exceptional 11.5% |
Demographics Similar to Dominicans by Poverty
In terms of poverty, the demographic groups most similar to Dominicans are Immigrants from Dominican Republic (17.8%, a difference of 0.92%), Black/African American (17.3%, a difference of 2.3%), Native/Alaskan (18.1%, a difference of 2.4%), Ute (16.9%, a difference of 4.3%), and Houma (18.4%, a difference of 4.4%).
| Demographics | Rating | Rank | Poverty |
| Colville | 0.0 /100 | #323 | Tragic 16.6% |
| Yakama | 0.0 /100 | #324 | Tragic 16.7% |
| Central American Indians | 0.0 /100 | #325 | Tragic 16.7% |
| Paiute | 0.0 /100 | #326 | Tragic 16.7% |
| Kiowa | 0.0 /100 | #327 | Tragic 16.8% |
| Ute | 0.0 /100 | #328 | Tragic 16.9% |
| Blacks/African Americans | 0.0 /100 | #329 | Tragic 17.3% |
| Dominicans | 0.0 /100 | #330 | Tragic 17.6% |
| Immigrants | Dominican Republic | 0.0 /100 | #331 | Tragic 17.8% |
| Natives/Alaskans | 0.0 /100 | #332 | Tragic 18.1% |
| Houma | 0.0 /100 | #333 | Tragic 18.4% |
| Apache | 0.0 /100 | #334 | Tragic 18.4% |
| Cheyenne | 0.0 /100 | #335 | Tragic 18.9% |
| Pueblo | 0.0 /100 | #336 | Tragic 19.4% |
| Sioux | 0.0 /100 | #337 | Tragic 19.8% |