Bhutanese vs Burmese Single Mother Poverty
COMPARE
Bhutanese
Burmese
Single Mother Poverty
Single Mother Poverty Comparison
Bhutanese
Burmese
25.6%
SINGLE MOTHER POVERTY
100.0/ 100
METRIC RATING
12th/ 347
METRIC RANK
26.2%
SINGLE MOTHER POVERTY
100.0/ 100
METRIC RATING
23rd/ 347
METRIC RANK
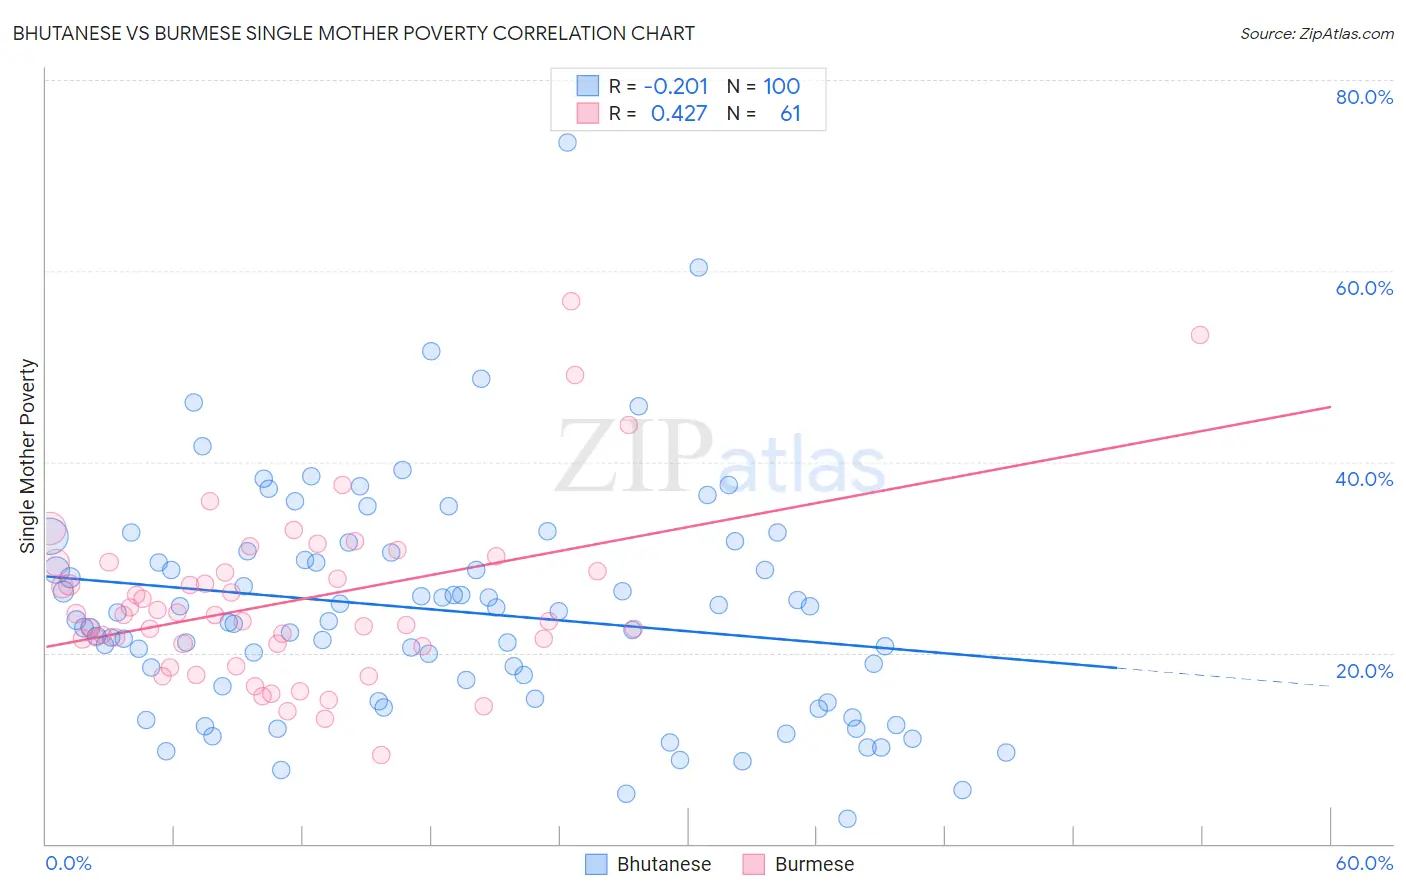
Bhutanese vs Burmese Single Mother Poverty Correlation Chart
The statistical analysis conducted on geographies consisting of 442,258,638 people shows a weak negative correlation between the proportion of Bhutanese and poverty level among single mothers in the United States with a correlation coefficient (R) of -0.201 and weighted average of 25.6%. Similarly, the statistical analysis conducted on geographies consisting of 450,482,396 people shows a moderate positive correlation between the proportion of Burmese and poverty level among single mothers in the United States with a correlation coefficient (R) of 0.427 and weighted average of 26.2%, a difference of 2.4%.
Single Mother Poverty Correlation Summary
| Measurement | Bhutanese | Burmese |
| Minimum | 2.6% | 9.3% |
| Maximum | 73.4% | 56.9% |
| Range | 70.8% | 47.5% |
| Mean | 24.4% | 25.3% |
| Median | 23.4% | 23.9% |
| Interquartile 25% (IQ1) | 15.9% | 20.8% |
| Interquartile 75% (IQ3) | 30.2% | 29.0% |
| Interquartile Range (IQR) | 14.3% | 8.3% |
| Standard Deviation (Sample) | 11.8% | 9.0% |
| Standard Deviation (Population) | 11.8% | 9.0% |
Demographics Similar to Bhutanese and Burmese by Single Mother Poverty
In terms of single mother poverty, the demographic groups most similar to Bhutanese are Iranian (25.5%, a difference of 0.37%), Indian (Asian) (25.8%, a difference of 0.52%), Immigrants from Singapore (25.8%, a difference of 0.67%), Immigrants from Ireland (25.8%, a difference of 0.86%), and Bolivian (25.9%, a difference of 1.1%). Similarly, the demographic groups most similar to Burmese are Immigrants from Moldova (26.2%, a difference of 0.020%), Immigrants from Korea (26.2%, a difference of 0.17%), Immigrants from Asia (26.3%, a difference of 0.22%), Immigrants from Bolivia (26.2%, a difference of 0.35%), and Immigrants from Sri Lanka (26.3%, a difference of 0.35%).
| Demographics | Rating | Rank | Single Mother Poverty |
| Chinese | 100.0 /100 | #7 | Exceptional 24.6% |
| Immigrants | Iran | 100.0 /100 | #8 | Exceptional 25.1% |
| Immigrants | Lithuania | 100.0 /100 | #9 | Exceptional 25.2% |
| Immigrants | South Central Asia | 100.0 /100 | #10 | Exceptional 25.3% |
| Iranians | 100.0 /100 | #11 | Exceptional 25.5% |
| Bhutanese | 100.0 /100 | #12 | Exceptional 25.6% |
| Indians (Asian) | 100.0 /100 | #13 | Exceptional 25.8% |
| Immigrants | Singapore | 100.0 /100 | #14 | Exceptional 25.8% |
| Immigrants | Ireland | 100.0 /100 | #15 | Exceptional 25.8% |
| Bolivians | 100.0 /100 | #16 | Exceptional 25.9% |
| Asians | 100.0 /100 | #17 | Exceptional 26.0% |
| Immigrants | Pakistan | 100.0 /100 | #18 | Exceptional 26.0% |
| Immigrants | Eastern Asia | 100.0 /100 | #19 | Exceptional 26.1% |
| Immigrants | China | 100.0 /100 | #20 | Exceptional 26.1% |
| Immigrants | Bolivia | 100.0 /100 | #21 | Exceptional 26.2% |
| Immigrants | Korea | 100.0 /100 | #22 | Exceptional 26.2% |
| Burmese | 100.0 /100 | #23 | Exceptional 26.2% |
| Immigrants | Moldova | 100.0 /100 | #24 | Exceptional 26.2% |
| Immigrants | Asia | 100.0 /100 | #25 | Exceptional 26.3% |
| Immigrants | Sri Lanka | 100.0 /100 | #26 | Exceptional 26.3% |
| Immigrants | Japan | 100.0 /100 | #27 | Exceptional 26.4% |