Afghan vs Burmese Single Mother Poverty
COMPARE
Afghan
Burmese
Single Mother Poverty
Single Mother Poverty Comparison
Afghans
Burmese
27.7%
SINGLE MOTHER POVERTY
98.5/ 100
METRIC RATING
87th/ 347
METRIC RANK
26.2%
SINGLE MOTHER POVERTY
100.0/ 100
METRIC RATING
23rd/ 347
METRIC RANK
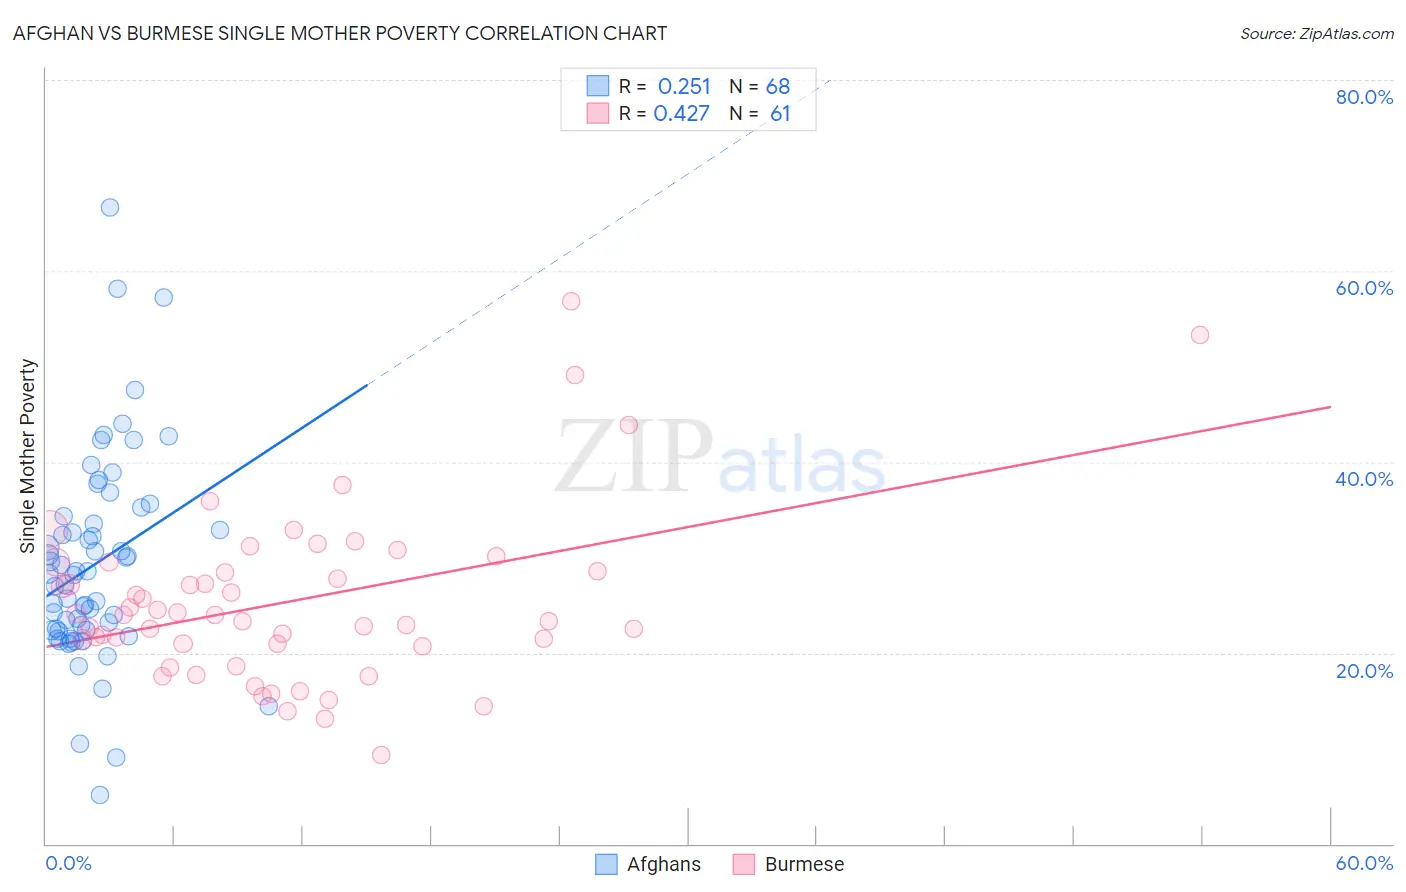
Afghan vs Burmese Single Mother Poverty Correlation Chart
The statistical analysis conducted on geographies consisting of 147,050,043 people shows a weak positive correlation between the proportion of Afghans and poverty level among single mothers in the United States with a correlation coefficient (R) of 0.251 and weighted average of 27.7%. Similarly, the statistical analysis conducted on geographies consisting of 450,482,396 people shows a moderate positive correlation between the proportion of Burmese and poverty level among single mothers in the United States with a correlation coefficient (R) of 0.427 and weighted average of 26.2%, a difference of 5.6%.
Single Mother Poverty Correlation Summary
| Measurement | Afghan | Burmese |
| Minimum | 5.1% | 9.3% |
| Maximum | 66.7% | 56.9% |
| Range | 61.5% | 47.5% |
| Mean | 29.3% | 25.3% |
| Median | 28.2% | 23.9% |
| Interquartile 25% (IQ1) | 22.4% | 20.8% |
| Interquartile 75% (IQ3) | 33.9% | 29.0% |
| Interquartile Range (IQR) | 11.6% | 8.3% |
| Standard Deviation (Sample) | 10.8% | 9.0% |
| Standard Deviation (Population) | 10.7% | 9.0% |
Similar Demographics by Single Mother Poverty
Demographics Similar to Afghans by Single Mother Poverty
In terms of single mother poverty, the demographic groups most similar to Afghans are Ethiopian (27.7%, a difference of 0.020%), Immigrants from Ethiopia (27.7%, a difference of 0.040%), Immigrants from Ukraine (27.7%, a difference of 0.10%), Mongolian (27.7%, a difference of 0.19%), and Immigrants from Latvia (27.7%, a difference of 0.20%).
| Demographics | Rating | Rank | Single Mother Poverty |
| Taiwanese | 99.1 /100 | #80 | Exceptional 27.5% |
| Immigrants | Scotland | 98.9 /100 | #81 | Exceptional 27.6% |
| Immigrants | Cameroon | 98.8 /100 | #82 | Exceptional 27.6% |
| Greeks | 98.7 /100 | #83 | Exceptional 27.7% |
| Immigrants | Latvia | 98.7 /100 | #84 | Exceptional 27.7% |
| Mongolians | 98.7 /100 | #85 | Exceptional 27.7% |
| Immigrants | Ukraine | 98.6 /100 | #86 | Exceptional 27.7% |
| Afghans | 98.5 /100 | #87 | Exceptional 27.7% |
| Ethiopians | 98.4 /100 | #88 | Exceptional 27.7% |
| Immigrants | Ethiopia | 98.4 /100 | #89 | Exceptional 27.7% |
| Immigrants | France | 98.2 /100 | #90 | Exceptional 27.8% |
| Immigrants | Albania | 98.0 /100 | #91 | Exceptional 27.8% |
| Estonians | 97.9 /100 | #92 | Exceptional 27.8% |
| Romanians | 97.8 /100 | #93 | Exceptional 27.8% |
| Albanians | 97.6 /100 | #94 | Exceptional 27.9% |
Demographics Similar to Burmese by Single Mother Poverty
In terms of single mother poverty, the demographic groups most similar to Burmese are Immigrants from Moldova (26.2%, a difference of 0.020%), Immigrants from Korea (26.2%, a difference of 0.17%), Immigrants from Asia (26.3%, a difference of 0.22%), Immigrants from Bolivia (26.2%, a difference of 0.35%), and Immigrants from Sri Lanka (26.3%, a difference of 0.35%).
| Demographics | Rating | Rank | Single Mother Poverty |
| Bolivians | 100.0 /100 | #16 | Exceptional 25.9% |
| Asians | 100.0 /100 | #17 | Exceptional 26.0% |
| Immigrants | Pakistan | 100.0 /100 | #18 | Exceptional 26.0% |
| Immigrants | Eastern Asia | 100.0 /100 | #19 | Exceptional 26.1% |
| Immigrants | China | 100.0 /100 | #20 | Exceptional 26.1% |
| Immigrants | Bolivia | 100.0 /100 | #21 | Exceptional 26.2% |
| Immigrants | Korea | 100.0 /100 | #22 | Exceptional 26.2% |
| Burmese | 100.0 /100 | #23 | Exceptional 26.2% |
| Immigrants | Moldova | 100.0 /100 | #24 | Exceptional 26.2% |
| Immigrants | Asia | 100.0 /100 | #25 | Exceptional 26.3% |
| Immigrants | Sri Lanka | 100.0 /100 | #26 | Exceptional 26.3% |
| Immigrants | Japan | 100.0 /100 | #27 | Exceptional 26.4% |
| Koreans | 100.0 /100 | #28 | Exceptional 26.4% |
| Jordanians | 100.0 /100 | #29 | Exceptional 26.4% |
| Turks | 100.0 /100 | #30 | Exceptional 26.4% |