Brazilian vs Burmese Female Disability
COMPARE
Brazilian
Burmese
Female Disability
Female Disability Comparison
Brazilians
Burmese
11.8%
FEMALE DISABILITY
97.7/ 100
METRIC RATING
115th/ 347
METRIC RANK
10.7%
FEMALE DISABILITY
100.0/ 100
METRIC RATING
15th/ 347
METRIC RANK
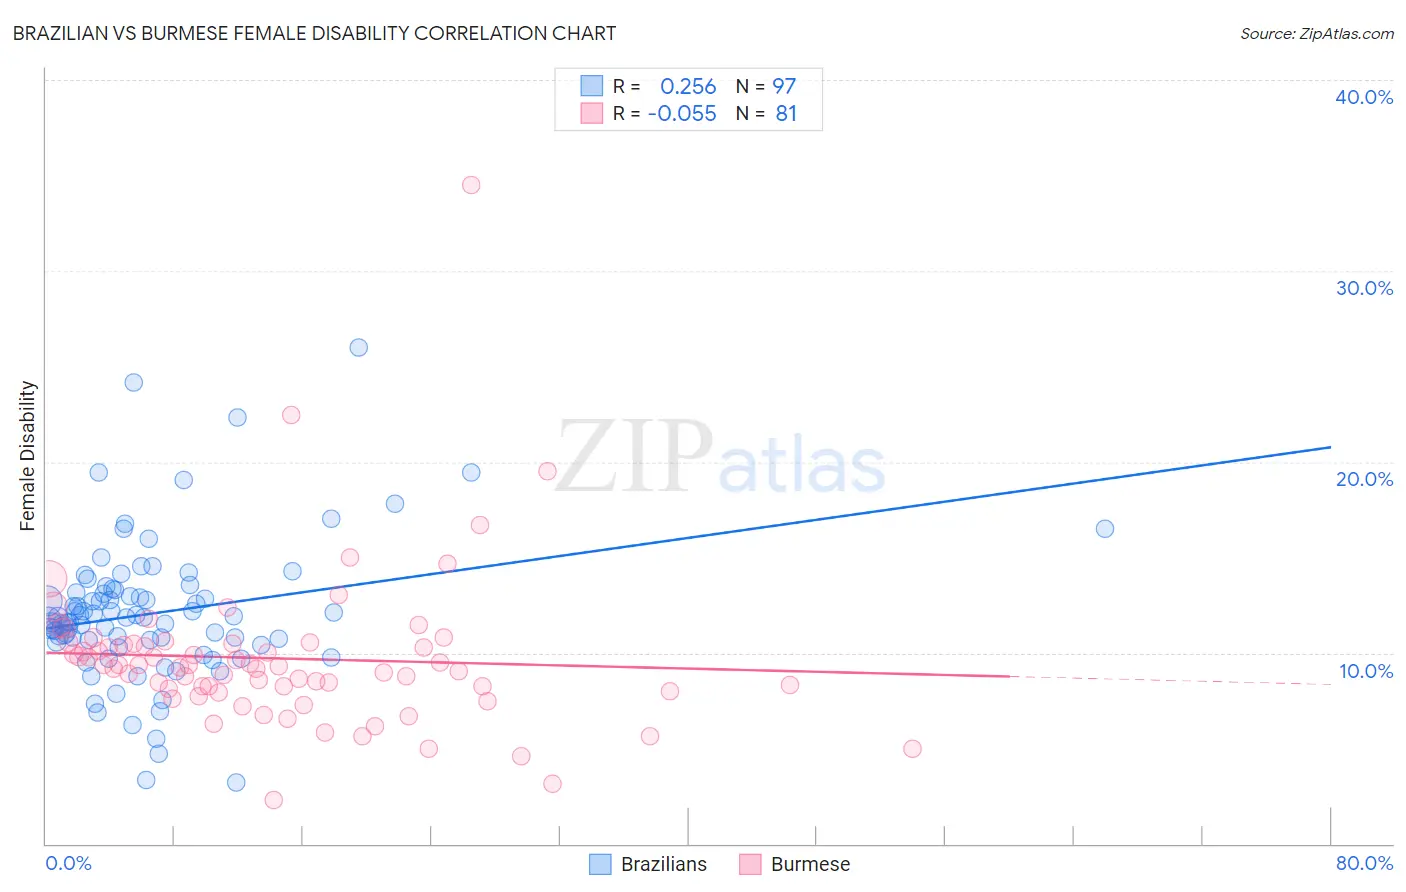
Brazilian vs Burmese Female Disability Correlation Chart
The statistical analysis conducted on geographies consisting of 323,948,952 people shows a weak positive correlation between the proportion of Brazilians and percentage of females with a disability in the United States with a correlation coefficient (R) of 0.256 and weighted average of 11.8%. Similarly, the statistical analysis conducted on geographies consisting of 465,299,673 people shows a slight negative correlation between the proportion of Burmese and percentage of females with a disability in the United States with a correlation coefficient (R) of -0.055 and weighted average of 10.7%, a difference of 9.5%.
Female Disability Correlation Summary
| Measurement | Brazilian | Burmese |
| Minimum | 3.2% | 2.3% |
| Maximum | 26.0% | 34.5% |
| Range | 22.7% | 32.2% |
| Mean | 12.1% | 9.7% |
| Median | 11.8% | 9.3% |
| Interquartile 25% (IQ1) | 10.6% | 8.1% |
| Interquartile 75% (IQ3) | 13.2% | 10.5% |
| Interquartile Range (IQR) | 2.6% | 2.4% |
| Standard Deviation (Sample) | 3.7% | 4.1% |
| Standard Deviation (Population) | 3.7% | 4.1% |
Similar Demographics by Female Disability
Demographics Similar to Brazilians by Female Disability
In terms of female disability, the demographic groups most similar to Brazilians are South African (11.8%, a difference of 0.0%), Immigrants from Belarus (11.8%, a difference of 0.030%), Immigrants from Bangladesh (11.8%, a difference of 0.040%), Immigrants from Morocco (11.8%, a difference of 0.040%), and Costa Rican (11.7%, a difference of 0.16%).
| Demographics | Rating | Rank | Female Disability |
| New Zealanders | 98.1 /100 | #108 | Exceptional 11.7% |
| Immigrants | Immigrants | 98.1 /100 | #109 | Exceptional 11.7% |
| Soviet Union | 98.1 /100 | #110 | Exceptional 11.7% |
| Costa Ricans | 98.1 /100 | #111 | Exceptional 11.7% |
| Immigrants | Bangladesh | 97.8 /100 | #112 | Exceptional 11.8% |
| Immigrants | Belarus | 97.8 /100 | #113 | Exceptional 11.8% |
| South Africans | 97.7 /100 | #114 | Exceptional 11.8% |
| Brazilians | 97.7 /100 | #115 | Exceptional 11.8% |
| Immigrants | Morocco | 97.6 /100 | #116 | Exceptional 11.8% |
| Immigrants | Eastern Europe | 97.2 /100 | #117 | Exceptional 11.8% |
| Immigrants | Nigeria | 97.2 /100 | #118 | Exceptional 11.8% |
| Immigrants | Uganda | 97.2 /100 | #119 | Exceptional 11.8% |
| Immigrants | Kazakhstan | 97.0 /100 | #120 | Exceptional 11.8% |
| Immigrants | Netherlands | 96.9 /100 | #121 | Exceptional 11.8% |
| Immigrants | North Macedonia | 96.8 /100 | #122 | Exceptional 11.8% |
Demographics Similar to Burmese by Female Disability
In terms of female disability, the demographic groups most similar to Burmese are Okinawan (10.8%, a difference of 0.070%), Indian (Asian) (10.8%, a difference of 0.39%), Immigrants from China (10.7%, a difference of 0.51%), Immigrants from Eastern Asia (10.7%, a difference of 0.54%), and Immigrants from Israel (10.7%, a difference of 0.62%).
| Demographics | Rating | Rank | Female Disability |
| Immigrants | South Central Asia | 100.0 /100 | #8 | Exceptional 10.5% |
| Iranians | 100.0 /100 | #9 | Exceptional 10.6% |
| Immigrants | Hong Kong | 100.0 /100 | #10 | Exceptional 10.6% |
| Immigrants | Korea | 100.0 /100 | #11 | Exceptional 10.6% |
| Immigrants | Israel | 100.0 /100 | #12 | Exceptional 10.7% |
| Immigrants | Eastern Asia | 100.0 /100 | #13 | Exceptional 10.7% |
| Immigrants | China | 100.0 /100 | #14 | Exceptional 10.7% |
| Burmese | 100.0 /100 | #15 | Exceptional 10.7% |
| Okinawans | 100.0 /100 | #16 | Exceptional 10.8% |
| Indians (Asian) | 100.0 /100 | #17 | Exceptional 10.8% |
| Immigrants | Iran | 100.0 /100 | #18 | Exceptional 10.8% |
| Immigrants | Venezuela | 100.0 /100 | #19 | Exceptional 10.9% |
| Immigrants | Pakistan | 100.0 /100 | #20 | Exceptional 10.9% |
| Asians | 100.0 /100 | #21 | Exceptional 10.9% |
| Immigrants | Sri Lanka | 100.0 /100 | #22 | Exceptional 10.9% |