Immigrants from Nicaragua vs Puget Sound Salish Poverty
COMPARE
Immigrants from Nicaragua
Puget Sound Salish
Poverty
Poverty Comparison
Immigrants from Nicaragua
Puget Sound Salish
14.3%
POVERTY
0.1/ 100
METRIC RATING
259th/ 347
METRIC RANK
11.7%
POVERTY
88.7/ 100
METRIC RATING
122nd/ 347
METRIC RANK
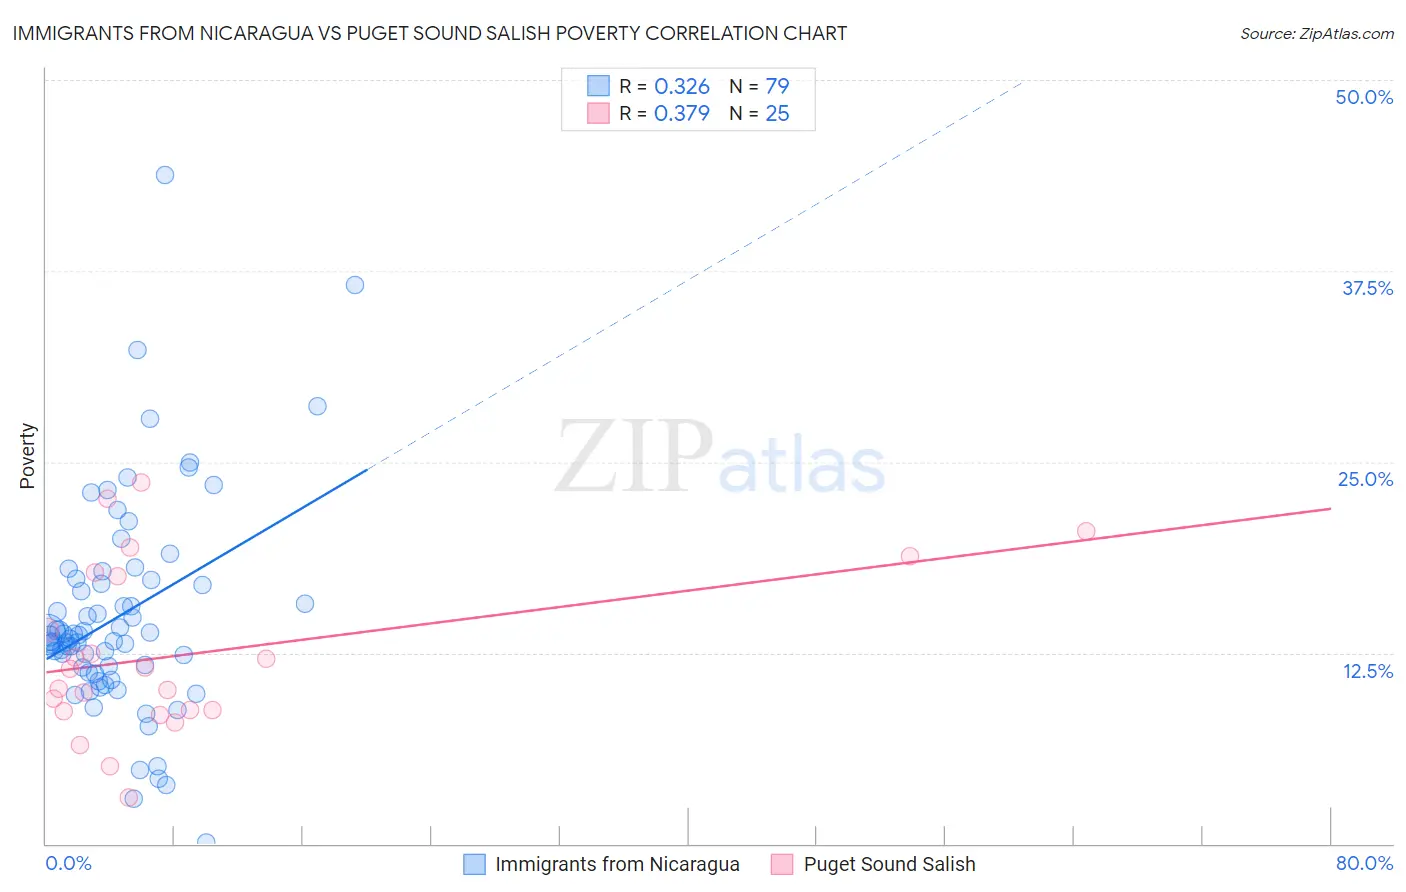
Immigrants from Nicaragua vs Puget Sound Salish Poverty Correlation Chart
The statistical analysis conducted on geographies consisting of 236,320,114 people shows a mild positive correlation between the proportion of Immigrants from Nicaragua and poverty level in the United States with a correlation coefficient (R) of 0.326 and weighted average of 14.3%. Similarly, the statistical analysis conducted on geographies consisting of 46,150,573 people shows a mild positive correlation between the proportion of Puget Sound Salish and poverty level in the United States with a correlation coefficient (R) of 0.379 and weighted average of 11.7%, a difference of 22.5%.
Poverty Correlation Summary
| Measurement | Immigrants from Nicaragua | Puget Sound Salish |
| Minimum | 0.098% | 3.0% |
| Maximum | 43.8% | 23.7% |
| Range | 43.7% | 20.7% |
| Mean | 14.9% | 12.4% |
| Median | 13.6% | 11.4% |
| Interquartile 25% (IQ1) | 11.2% | 8.7% |
| Interquartile 75% (IQ3) | 17.3% | 17.7% |
| Interquartile Range (IQR) | 6.1% | 9.0% |
| Standard Deviation (Sample) | 7.1% | 5.5% |
| Standard Deviation (Population) | 7.0% | 5.4% |
Similar Demographics by Poverty
Demographics Similar to Immigrants from Nicaragua by Poverty
In terms of poverty, the demographic groups most similar to Immigrants from Nicaragua are Cape Verdean (14.4%, a difference of 0.080%), Cherokee (14.4%, a difference of 0.10%), Immigrants from Liberia (14.4%, a difference of 0.26%), Ottawa (14.3%, a difference of 0.27%), and Trinidadian and Tobagonian (14.3%, a difference of 0.28%).
| Demographics | Rating | Rank | Poverty |
| Spanish American Indians | 0.2 /100 | #252 | Tragic 14.2% |
| Immigrants | Trinidad and Tobago | 0.2 /100 | #253 | Tragic 14.2% |
| Immigrants | El Salvador | 0.1 /100 | #254 | Tragic 14.3% |
| Immigrants | Ecuador | 0.1 /100 | #255 | Tragic 14.3% |
| Mexican American Indians | 0.1 /100 | #256 | Tragic 14.3% |
| Trinidadians and Tobagonians | 0.1 /100 | #257 | Tragic 14.3% |
| Ottawa | 0.1 /100 | #258 | Tragic 14.3% |
| Immigrants | Nicaragua | 0.1 /100 | #259 | Tragic 14.3% |
| Cape Verdeans | 0.1 /100 | #260 | Tragic 14.4% |
| Cherokee | 0.1 /100 | #261 | Tragic 14.4% |
| Immigrants | Liberia | 0.1 /100 | #262 | Tragic 14.4% |
| Jamaicans | 0.1 /100 | #263 | Tragic 14.4% |
| Immigrants | Jamaica | 0.1 /100 | #264 | Tragic 14.4% |
| Immigrants | Guyana | 0.1 /100 | #265 | Tragic 14.5% |
| Guyanese | 0.1 /100 | #266 | Tragic 14.5% |
Demographics Similar to Puget Sound Salish by Poverty
In terms of poverty, the demographic groups most similar to Puget Sound Salish are New Zealander (11.7%, a difference of 0.0%), Immigrants from Hungary (11.7%, a difference of 0.020%), Immigrants from South Eastern Asia (11.7%, a difference of 0.060%), Tlingit-Haida (11.7%, a difference of 0.070%), and Soviet Union (11.7%, a difference of 0.090%).
| Demographics | Rating | Rank | Poverty |
| Albanians | 90.3 /100 | #115 | Exceptional 11.7% |
| Immigrants | Russia | 89.7 /100 | #116 | Excellent 11.7% |
| Sri Lankans | 89.4 /100 | #117 | Excellent 11.7% |
| Argentineans | 89.1 /100 | #118 | Excellent 11.7% |
| Tlingit-Haida | 89.0 /100 | #119 | Excellent 11.7% |
| Immigrants | South Eastern Asia | 88.9 /100 | #120 | Excellent 11.7% |
| New Zealanders | 88.7 /100 | #121 | Excellent 11.7% |
| Puget Sound Salish | 88.7 /100 | #122 | Excellent 11.7% |
| Immigrants | Hungary | 88.6 /100 | #123 | Excellent 11.7% |
| Soviet Union | 88.4 /100 | #124 | Excellent 11.7% |
| Immigrants | Brazil | 88.2 /100 | #125 | Excellent 11.7% |
| Immigrants | Norway | 88.0 /100 | #126 | Excellent 11.7% |
| Immigrants | Argentina | 88.0 /100 | #127 | Excellent 11.7% |
| Immigrants | Israel | 87.4 /100 | #128 | Excellent 11.7% |
| South Africans | 87.0 /100 | #129 | Excellent 11.7% |