Immigrants from Scotland vs Puget Sound Salish Poverty
COMPARE
Immigrants from Scotland
Puget Sound Salish
Poverty
Poverty Comparison
Immigrants from Scotland
Puget Sound Salish
10.6%
POVERTY
99.7/ 100
METRIC RATING
19th/ 347
METRIC RANK
11.7%
POVERTY
88.7/ 100
METRIC RATING
122nd/ 347
METRIC RANK
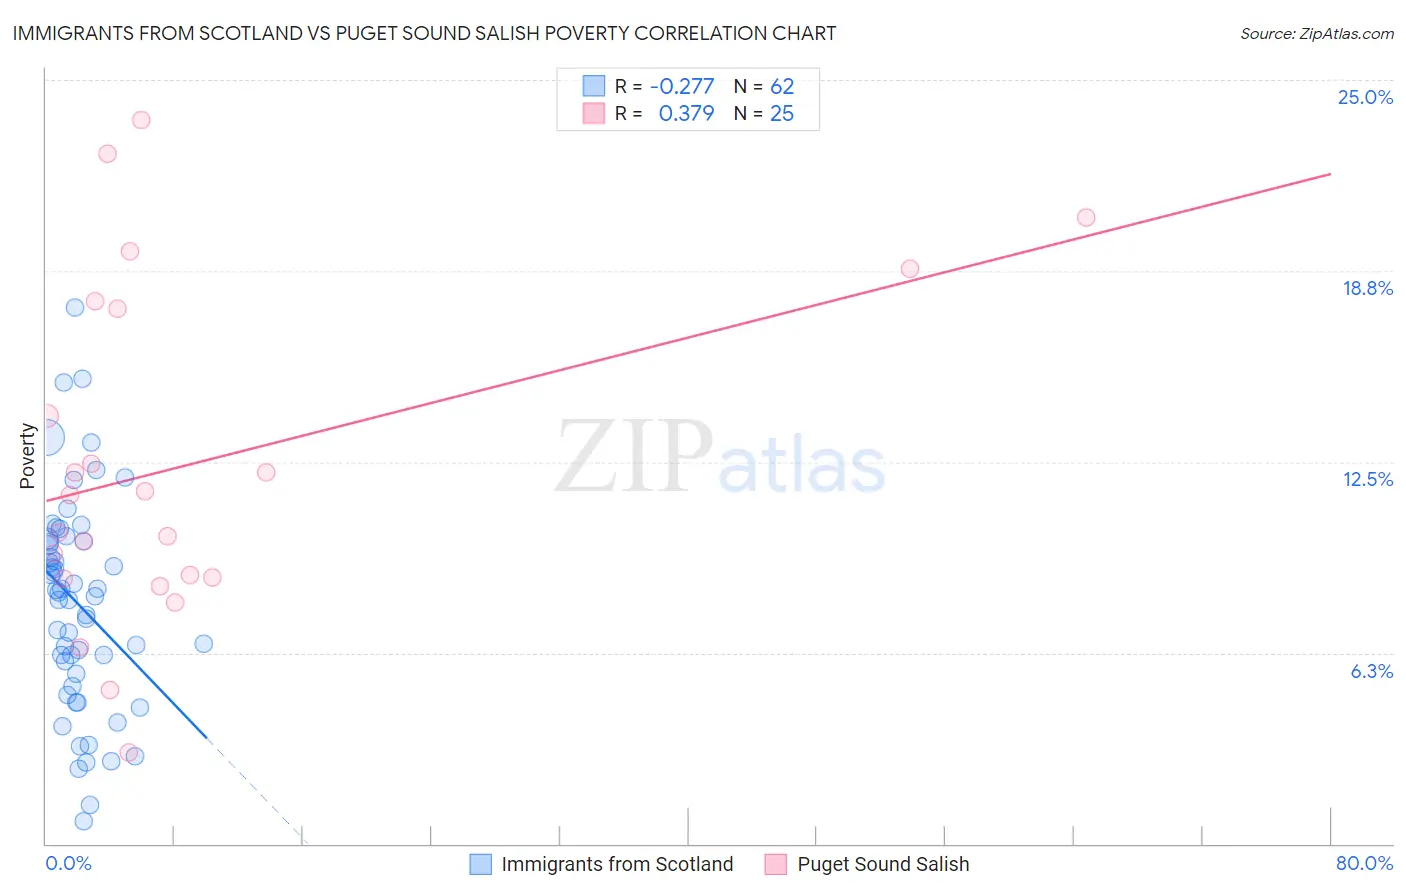
Immigrants from Scotland vs Puget Sound Salish Poverty Correlation Chart
The statistical analysis conducted on geographies consisting of 196,384,756 people shows a weak negative correlation between the proportion of Immigrants from Scotland and poverty level in the United States with a correlation coefficient (R) of -0.277 and weighted average of 10.6%. Similarly, the statistical analysis conducted on geographies consisting of 46,150,573 people shows a mild positive correlation between the proportion of Puget Sound Salish and poverty level in the United States with a correlation coefficient (R) of 0.379 and weighted average of 11.7%, a difference of 10.8%.
Poverty Correlation Summary
| Measurement | Immigrants from Scotland | Puget Sound Salish |
| Minimum | 0.74% | 3.0% |
| Maximum | 17.6% | 23.7% |
| Range | 16.8% | 20.7% |
| Mean | 7.8% | 12.4% |
| Median | 8.2% | 11.4% |
| Interquartile 25% (IQ1) | 5.6% | 8.7% |
| Interquartile 75% (IQ3) | 9.9% | 17.7% |
| Interquartile Range (IQR) | 4.4% | 9.0% |
| Standard Deviation (Sample) | 3.5% | 5.5% |
| Standard Deviation (Population) | 3.4% | 5.4% |
Similar Demographics by Poverty
Demographics Similar to Immigrants from Scotland by Poverty
In terms of poverty, the demographic groups most similar to Immigrants from Scotland are Immigrants from North Macedonia (10.6%, a difference of 0.11%), Luxembourger (10.6%, a difference of 0.19%), Eastern European (10.6%, a difference of 0.35%), Latvian (10.5%, a difference of 0.39%), and Swedish (10.6%, a difference of 0.46%).
| Demographics | Rating | Rank | Poverty |
| Bhutanese | 99.8 /100 | #12 | Exceptional 10.4% |
| Immigrants | Hong Kong | 99.8 /100 | #13 | Exceptional 10.4% |
| Immigrants | Bolivia | 99.8 /100 | #14 | Exceptional 10.4% |
| Bolivians | 99.8 /100 | #15 | Exceptional 10.4% |
| Lithuanians | 99.8 /100 | #16 | Exceptional 10.5% |
| Norwegians | 99.8 /100 | #17 | Exceptional 10.5% |
| Latvians | 99.8 /100 | #18 | Exceptional 10.5% |
| Immigrants | Scotland | 99.7 /100 | #19 | Exceptional 10.6% |
| Immigrants | North Macedonia | 99.7 /100 | #20 | Exceptional 10.6% |
| Luxembourgers | 99.7 /100 | #21 | Exceptional 10.6% |
| Eastern Europeans | 99.7 /100 | #22 | Exceptional 10.6% |
| Swedes | 99.7 /100 | #23 | Exceptional 10.6% |
| Italians | 99.7 /100 | #24 | Exceptional 10.6% |
| Croatians | 99.6 /100 | #25 | Exceptional 10.6% |
| Burmese | 99.6 /100 | #26 | Exceptional 10.7% |
Demographics Similar to Puget Sound Salish by Poverty
In terms of poverty, the demographic groups most similar to Puget Sound Salish are New Zealander (11.7%, a difference of 0.0%), Immigrants from Hungary (11.7%, a difference of 0.020%), Immigrants from South Eastern Asia (11.7%, a difference of 0.060%), Tlingit-Haida (11.7%, a difference of 0.070%), and Soviet Union (11.7%, a difference of 0.090%).
| Demographics | Rating | Rank | Poverty |
| Albanians | 90.3 /100 | #115 | Exceptional 11.7% |
| Immigrants | Russia | 89.7 /100 | #116 | Excellent 11.7% |
| Sri Lankans | 89.4 /100 | #117 | Excellent 11.7% |
| Argentineans | 89.1 /100 | #118 | Excellent 11.7% |
| Tlingit-Haida | 89.0 /100 | #119 | Excellent 11.7% |
| Immigrants | South Eastern Asia | 88.9 /100 | #120 | Excellent 11.7% |
| New Zealanders | 88.7 /100 | #121 | Excellent 11.7% |
| Puget Sound Salish | 88.7 /100 | #122 | Excellent 11.7% |
| Immigrants | Hungary | 88.6 /100 | #123 | Excellent 11.7% |
| Soviet Union | 88.4 /100 | #124 | Excellent 11.7% |
| Immigrants | Brazil | 88.2 /100 | #125 | Excellent 11.7% |
| Immigrants | Norway | 88.0 /100 | #126 | Excellent 11.7% |
| Immigrants | Argentina | 88.0 /100 | #127 | Excellent 11.7% |
| Immigrants | Israel | 87.4 /100 | #128 | Excellent 11.7% |
| South Africans | 87.0 /100 | #129 | Excellent 11.7% |