Black/African American vs Alsatian Child Poverty Among Girls Under 16
COMPARE
Black/African American
Alsatian
Child Poverty Among Girls Under 16
Child Poverty Among Girls Under 16 Comparison
Blacks/African Americans
Alsatians
24.7%
CHILD POVERTY AMONG GIRLS UNDER 16
0.0/ 100
METRIC RATING
333rd/ 347
METRIC RANK
18.6%
CHILD POVERTY AMONG GIRLS UNDER 16
1.1/ 100
METRIC RATING
236th/ 347
METRIC RANK
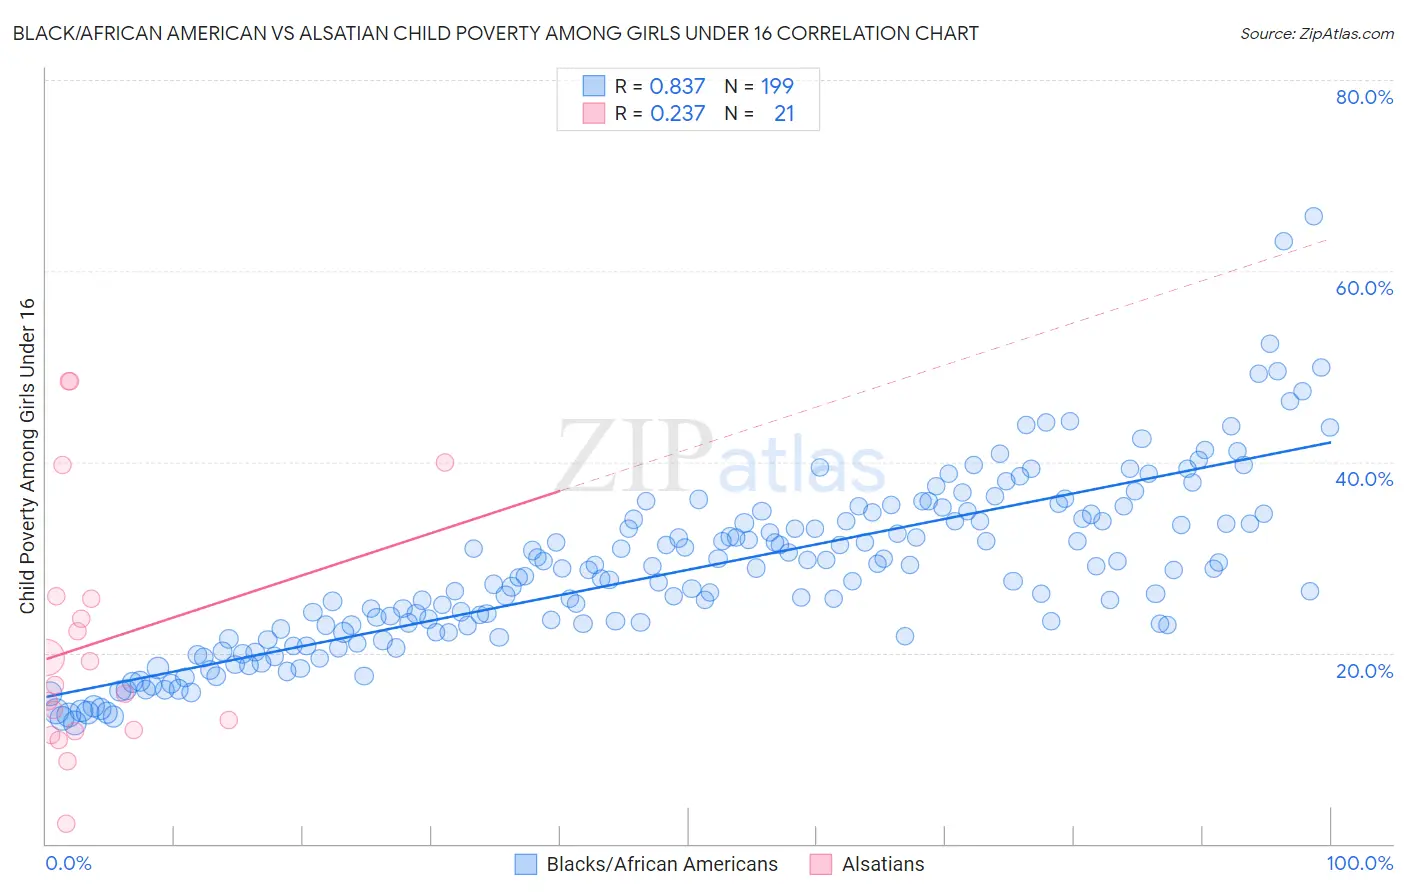
Black/African American vs Alsatian Child Poverty Among Girls Under 16 Correlation Chart
The statistical analysis conducted on geographies consisting of 546,554,396 people shows a very strong positive correlation between the proportion of Blacks/African Americans and poverty level among girls under the age of 16 in the United States with a correlation coefficient (R) of 0.837 and weighted average of 24.7%. Similarly, the statistical analysis conducted on geographies consisting of 82,194,745 people shows a weak positive correlation between the proportion of Alsatians and poverty level among girls under the age of 16 in the United States with a correlation coefficient (R) of 0.237 and weighted average of 18.6%, a difference of 32.4%.
Child Poverty Among Girls Under 16 Correlation Summary
| Measurement | Black/African American | Alsatian |
| Minimum | 12.6% | 2.1% |
| Maximum | 65.8% | 48.4% |
| Range | 53.1% | 46.3% |
| Mean | 28.6% | 21.1% |
| Median | 28.6% | 16.6% |
| Interquartile 25% (IQ1) | 22.1% | 11.8% |
| Interquartile 75% (IQ3) | 34.0% | 25.8% |
| Interquartile Range (IQR) | 11.9% | 14.0% |
| Standard Deviation (Sample) | 9.2% | 12.9% |
| Standard Deviation (Population) | 9.2% | 12.6% |
Similar Demographics by Child Poverty Among Girls Under 16
Demographics Similar to Blacks/African Americans by Child Poverty Among Girls Under 16
In terms of child poverty among girls under 16, the demographic groups most similar to Blacks/African Americans are Menominee (25.0%, a difference of 1.5%), Pueblo (25.2%, a difference of 2.2%), Native/Alaskan (24.0%, a difference of 2.5%), Apache (23.8%, a difference of 3.4%), and Immigrants from Dominican Republic (23.8%, a difference of 3.5%).
| Demographics | Rating | Rank | Child Poverty Among Girls Under 16 |
| Immigrants | Honduras | 0.0 /100 | #326 | Tragic 22.8% |
| Central American Indians | 0.0 /100 | #327 | Tragic 22.8% |
| Dominicans | 0.0 /100 | #328 | Tragic 23.7% |
| Kiowa | 0.0 /100 | #329 | Tragic 23.7% |
| Immigrants | Dominican Republic | 0.0 /100 | #330 | Tragic 23.8% |
| Apache | 0.0 /100 | #331 | Tragic 23.8% |
| Natives/Alaskans | 0.0 /100 | #332 | Tragic 24.0% |
| Blacks/African Americans | 0.0 /100 | #333 | Tragic 24.7% |
| Menominee | 0.0 /100 | #334 | Tragic 25.0% |
| Pueblo | 0.0 /100 | #335 | Tragic 25.2% |
| Sioux | 0.0 /100 | #336 | Tragic 25.6% |
| Yup'ik | 0.0 /100 | #337 | Tragic 25.8% |
| Cheyenne | 0.0 /100 | #338 | Tragic 26.3% |
| Crow | 0.0 /100 | #339 | Tragic 26.4% |
| Yuman | 0.0 /100 | #340 | Tragic 27.1% |
Demographics Similar to Alsatians by Child Poverty Among Girls Under 16
In terms of child poverty among girls under 16, the demographic groups most similar to Alsatians are Nepalese (18.6%, a difference of 0.010%), Fijian (18.6%, a difference of 0.060%), Sudanese (18.6%, a difference of 0.13%), Immigrants from Nigeria (18.6%, a difference of 0.13%), and Immigrants from Sudan (18.6%, a difference of 0.17%).
| Demographics | Rating | Rank | Child Poverty Among Girls Under 16 |
| Ghanaians | 1.4 /100 | #229 | Tragic 18.5% |
| Osage | 1.3 /100 | #230 | Tragic 18.5% |
| Cree | 1.3 /100 | #231 | Tragic 18.5% |
| Immigrants | Sudan | 1.1 /100 | #232 | Tragic 18.6% |
| Sudanese | 1.1 /100 | #233 | Tragic 18.6% |
| Fijians | 1.1 /100 | #234 | Tragic 18.6% |
| Nepalese | 1.1 /100 | #235 | Tragic 18.6% |
| Alsatians | 1.1 /100 | #236 | Tragic 18.6% |
| Immigrants | Nigeria | 1.0 /100 | #237 | Tragic 18.6% |
| Immigrants | Eritrea | 1.0 /100 | #238 | Tragic 18.7% |
| Marshallese | 0.9 /100 | #239 | Tragic 18.7% |
| Nigerians | 0.9 /100 | #240 | Tragic 18.7% |
| Americans | 0.8 /100 | #241 | Tragic 18.8% |
| Immigrants | Cuba | 0.7 /100 | #242 | Tragic 18.8% |
| Immigrants | Nicaragua | 0.7 /100 | #243 | Tragic 18.8% |