Black/African American vs Immigrants from Zimbabwe Child Poverty Among Girls Under 16
COMPARE
Black/African American
Immigrants from Zimbabwe
Child Poverty Among Girls Under 16
Child Poverty Among Girls Under 16 Comparison
Blacks/African Americans
Immigrants from Zimbabwe
24.7%
CHILD POVERTY AMONG GIRLS UNDER 16
0.0/ 100
METRIC RATING
333rd/ 347
METRIC RANK
15.3%
CHILD POVERTY AMONG GIRLS UNDER 16
92.5/ 100
METRIC RATING
119th/ 347
METRIC RANK
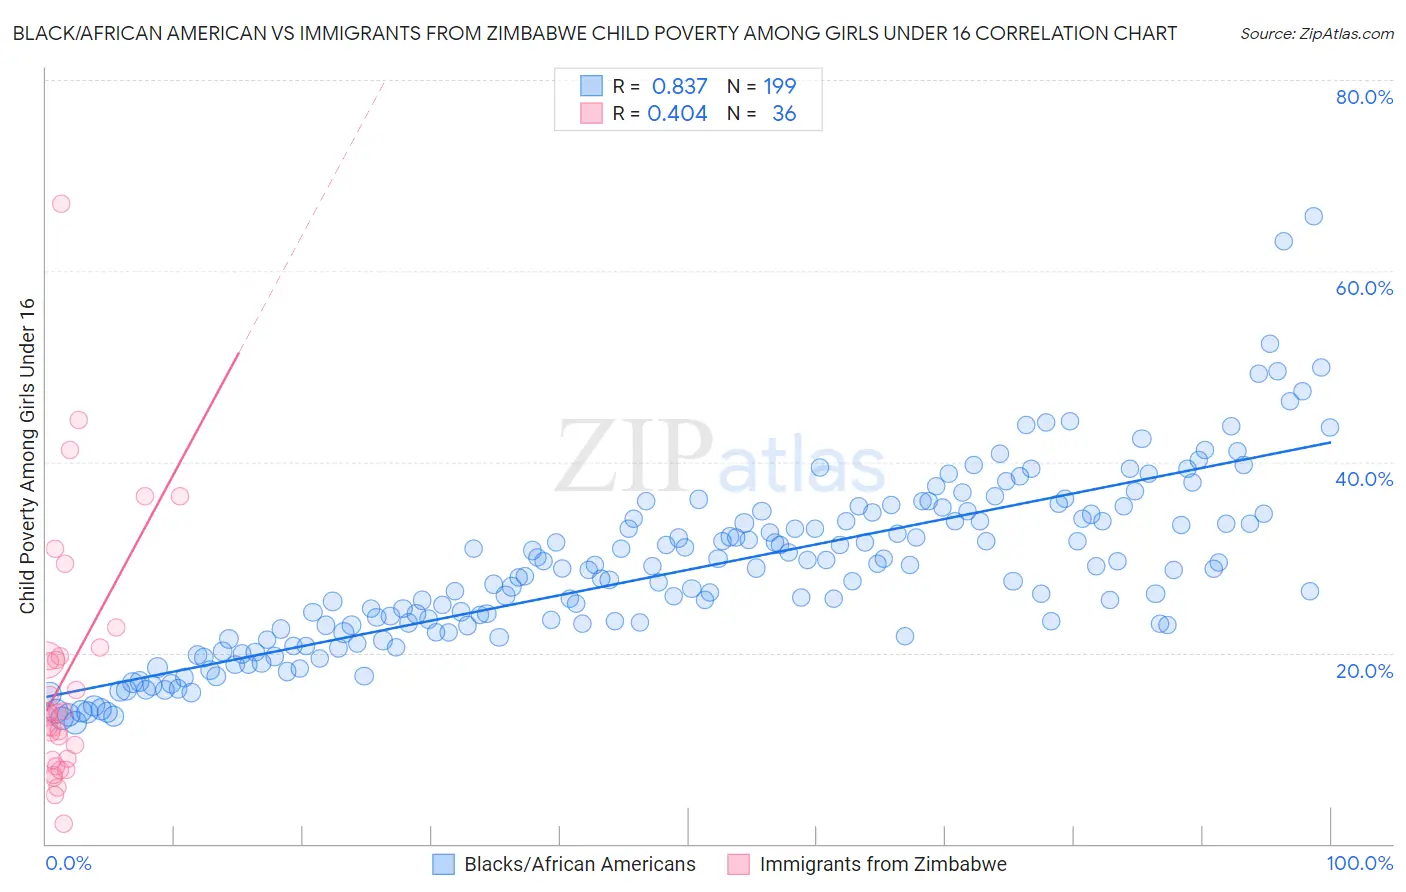
Black/African American vs Immigrants from Zimbabwe Child Poverty Among Girls Under 16 Correlation Chart
The statistical analysis conducted on geographies consisting of 546,554,396 people shows a very strong positive correlation between the proportion of Blacks/African Americans and poverty level among girls under the age of 16 in the United States with a correlation coefficient (R) of 0.837 and weighted average of 24.7%. Similarly, the statistical analysis conducted on geographies consisting of 117,219,082 people shows a moderate positive correlation between the proportion of Immigrants from Zimbabwe and poverty level among girls under the age of 16 in the United States with a correlation coefficient (R) of 0.404 and weighted average of 15.3%, a difference of 61.3%.
Child Poverty Among Girls Under 16 Correlation Summary
| Measurement | Black/African American | Immigrants from Zimbabwe |
| Minimum | 12.6% | 2.0% |
| Maximum | 65.8% | 67.0% |
| Range | 53.1% | 64.9% |
| Mean | 28.6% | 17.9% |
| Median | 28.6% | 13.8% |
| Interquartile 25% (IQ1) | 22.1% | 8.8% |
| Interquartile 75% (IQ3) | 34.0% | 20.1% |
| Interquartile Range (IQR) | 11.9% | 11.3% |
| Standard Deviation (Sample) | 9.2% | 13.4% |
| Standard Deviation (Population) | 9.2% | 13.2% |
Similar Demographics by Child Poverty Among Girls Under 16
Demographics Similar to Blacks/African Americans by Child Poverty Among Girls Under 16
In terms of child poverty among girls under 16, the demographic groups most similar to Blacks/African Americans are Menominee (25.0%, a difference of 1.5%), Pueblo (25.2%, a difference of 2.2%), Native/Alaskan (24.0%, a difference of 2.5%), Apache (23.8%, a difference of 3.4%), and Immigrants from Dominican Republic (23.8%, a difference of 3.5%).
| Demographics | Rating | Rank | Child Poverty Among Girls Under 16 |
| Immigrants | Honduras | 0.0 /100 | #326 | Tragic 22.8% |
| Central American Indians | 0.0 /100 | #327 | Tragic 22.8% |
| Dominicans | 0.0 /100 | #328 | Tragic 23.7% |
| Kiowa | 0.0 /100 | #329 | Tragic 23.7% |
| Immigrants | Dominican Republic | 0.0 /100 | #330 | Tragic 23.8% |
| Apache | 0.0 /100 | #331 | Tragic 23.8% |
| Natives/Alaskans | 0.0 /100 | #332 | Tragic 24.0% |
| Blacks/African Americans | 0.0 /100 | #333 | Tragic 24.7% |
| Menominee | 0.0 /100 | #334 | Tragic 25.0% |
| Pueblo | 0.0 /100 | #335 | Tragic 25.2% |
| Sioux | 0.0 /100 | #336 | Tragic 25.6% |
| Yup'ik | 0.0 /100 | #337 | Tragic 25.8% |
| Cheyenne | 0.0 /100 | #338 | Tragic 26.3% |
| Crow | 0.0 /100 | #339 | Tragic 26.4% |
| Yuman | 0.0 /100 | #340 | Tragic 27.1% |
Demographics Similar to Immigrants from Zimbabwe by Child Poverty Among Girls Under 16
In terms of child poverty among girls under 16, the demographic groups most similar to Immigrants from Zimbabwe are Pakistani (15.3%, a difference of 0.090%), Immigrants from Southern Europe (15.3%, a difference of 0.11%), English (15.3%, a difference of 0.11%), Immigrants from North Macedonia (15.2%, a difference of 0.29%), and Portuguese (15.3%, a difference of 0.30%).
| Demographics | Rating | Rank | Child Poverty Among Girls Under 16 |
| Immigrants | Kazakhstan | 94.3 /100 | #112 | Exceptional 15.1% |
| Dutch | 94.3 /100 | #113 | Exceptional 15.1% |
| Sri Lankans | 94.0 /100 | #114 | Exceptional 15.2% |
| Belgians | 93.9 /100 | #115 | Exceptional 15.2% |
| Immigrants | Denmark | 93.3 /100 | #116 | Exceptional 15.2% |
| Immigrants | North Macedonia | 93.1 /100 | #117 | Exceptional 15.2% |
| Immigrants | Southern Europe | 92.7 /100 | #118 | Exceptional 15.3% |
| Immigrants | Zimbabwe | 92.5 /100 | #119 | Exceptional 15.3% |
| Pakistanis | 92.3 /100 | #120 | Exceptional 15.3% |
| English | 92.2 /100 | #121 | Exceptional 15.3% |
| Portuguese | 91.8 /100 | #122 | Exceptional 15.3% |
| Irish | 91.5 /100 | #123 | Exceptional 15.3% |
| Carpatho Rusyns | 91.4 /100 | #124 | Exceptional 15.3% |
| Peruvians | 91.2 /100 | #125 | Exceptional 15.4% |
| Scottish | 91.0 /100 | #126 | Exceptional 15.4% |