Cuban vs Alsatian Child Poverty Among Girls Under 16
COMPARE
Cuban
Alsatian
Child Poverty Among Girls Under 16
Child Poverty Among Girls Under 16 Comparison
Cubans
Alsatians
18.0%
CHILD POVERTY AMONG GIRLS UNDER 16
4.1/ 100
METRIC RATING
220th/ 347
METRIC RANK
18.6%
CHILD POVERTY AMONG GIRLS UNDER 16
1.1/ 100
METRIC RATING
236th/ 347
METRIC RANK
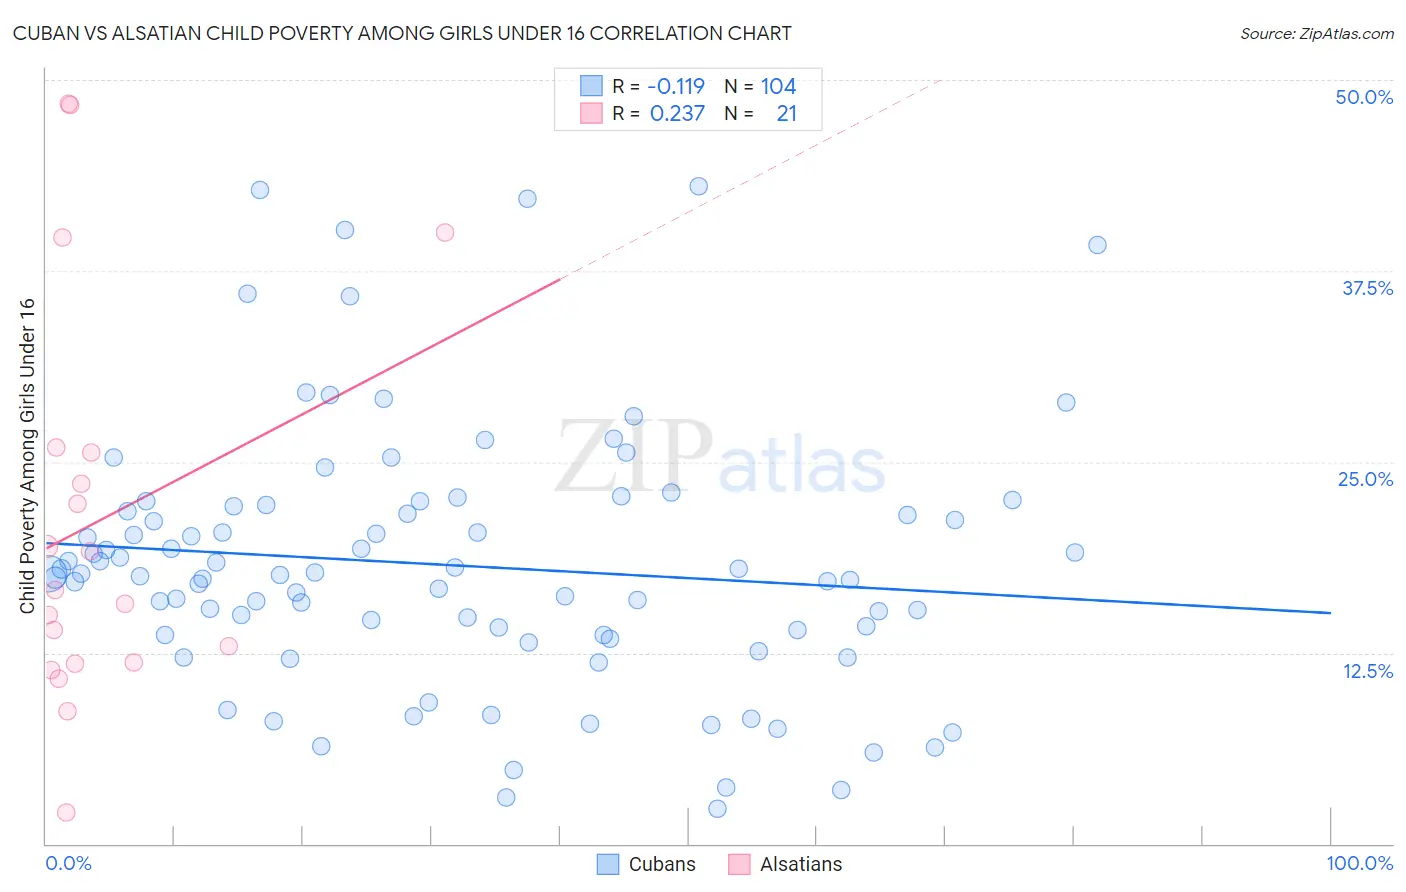
Cuban vs Alsatian Child Poverty Among Girls Under 16 Correlation Chart
The statistical analysis conducted on geographies consisting of 440,192,797 people shows a poor negative correlation between the proportion of Cubans and poverty level among girls under the age of 16 in the United States with a correlation coefficient (R) of -0.119 and weighted average of 18.0%. Similarly, the statistical analysis conducted on geographies consisting of 82,194,745 people shows a weak positive correlation between the proportion of Alsatians and poverty level among girls under the age of 16 in the United States with a correlation coefficient (R) of 0.237 and weighted average of 18.6%, a difference of 3.6%.
Child Poverty Among Girls Under 16 Correlation Summary
| Measurement | Cuban | Alsatian |
| Minimum | 2.3% | 2.1% |
| Maximum | 43.1% | 48.4% |
| Range | 40.8% | 46.3% |
| Mean | 18.2% | 21.1% |
| Median | 17.6% | 16.6% |
| Interquartile 25% (IQ1) | 13.7% | 11.8% |
| Interquartile 75% (IQ3) | 21.9% | 25.8% |
| Interquartile Range (IQR) | 8.3% | 14.0% |
| Standard Deviation (Sample) | 8.5% | 12.9% |
| Standard Deviation (Population) | 8.5% | 12.6% |
Demographics Similar to Cubans and Alsatians by Child Poverty Among Girls Under 16
In terms of child poverty among girls under 16, the demographic groups most similar to Cubans are Immigrants from Panama (17.9%, a difference of 0.38%), Immigrants from Micronesia (18.0%, a difference of 0.43%), Alaska Native (17.8%, a difference of 0.62%), Immigrants from Cambodia (18.1%, a difference of 0.95%), and Immigrants from Armenia (18.1%, a difference of 0.95%). Similarly, the demographic groups most similar to Alsatians are Nepalese (18.6%, a difference of 0.010%), Fijian (18.6%, a difference of 0.060%), Sudanese (18.6%, a difference of 0.13%), Immigrants from Nigeria (18.6%, a difference of 0.13%), and Immigrants from Sudan (18.6%, a difference of 0.17%).
| Demographics | Rating | Rank | Child Poverty Among Girls Under 16 |
| Alaska Natives | 5.2 /100 | #218 | Tragic 17.8% |
| Immigrants | Panama | 4.7 /100 | #219 | Tragic 17.9% |
| Cubans | 4.1 /100 | #220 | Tragic 18.0% |
| Immigrants | Micronesia | 3.5 /100 | #221 | Tragic 18.0% |
| Immigrants | Cambodia | 2.9 /100 | #222 | Tragic 18.1% |
| Immigrants | Armenia | 2.9 /100 | #223 | Tragic 18.1% |
| Bermudans | 2.8 /100 | #224 | Tragic 18.1% |
| Immigrants | Africa | 2.7 /100 | #225 | Tragic 18.2% |
| Nicaraguans | 2.4 /100 | #226 | Tragic 18.2% |
| Immigrants | Nonimmigrants | 2.0 /100 | #227 | Tragic 18.3% |
| Alaskan Athabascans | 2.0 /100 | #228 | Tragic 18.3% |
| Ghanaians | 1.4 /100 | #229 | Tragic 18.5% |
| Osage | 1.3 /100 | #230 | Tragic 18.5% |
| Cree | 1.3 /100 | #231 | Tragic 18.5% |
| Immigrants | Sudan | 1.1 /100 | #232 | Tragic 18.6% |
| Sudanese | 1.1 /100 | #233 | Tragic 18.6% |
| Fijians | 1.1 /100 | #234 | Tragic 18.6% |
| Nepalese | 1.1 /100 | #235 | Tragic 18.6% |
| Alsatians | 1.1 /100 | #236 | Tragic 18.6% |
| Immigrants | Nigeria | 1.0 /100 | #237 | Tragic 18.6% |
| Immigrants | Eritrea | 1.0 /100 | #238 | Tragic 18.7% |