Barbadian vs Immigrants from Scotland 9th Grade
COMPARE
Barbadian
Immigrants from Scotland
9th Grade
9th Grade Comparison
Barbadians
Immigrants from Scotland
93.5%
9TH GRADE
0.0/ 100
METRIC RATING
283rd/ 347
METRIC RANK
96.1%
9TH GRADE
99.9/ 100
METRIC RATING
38th/ 347
METRIC RANK
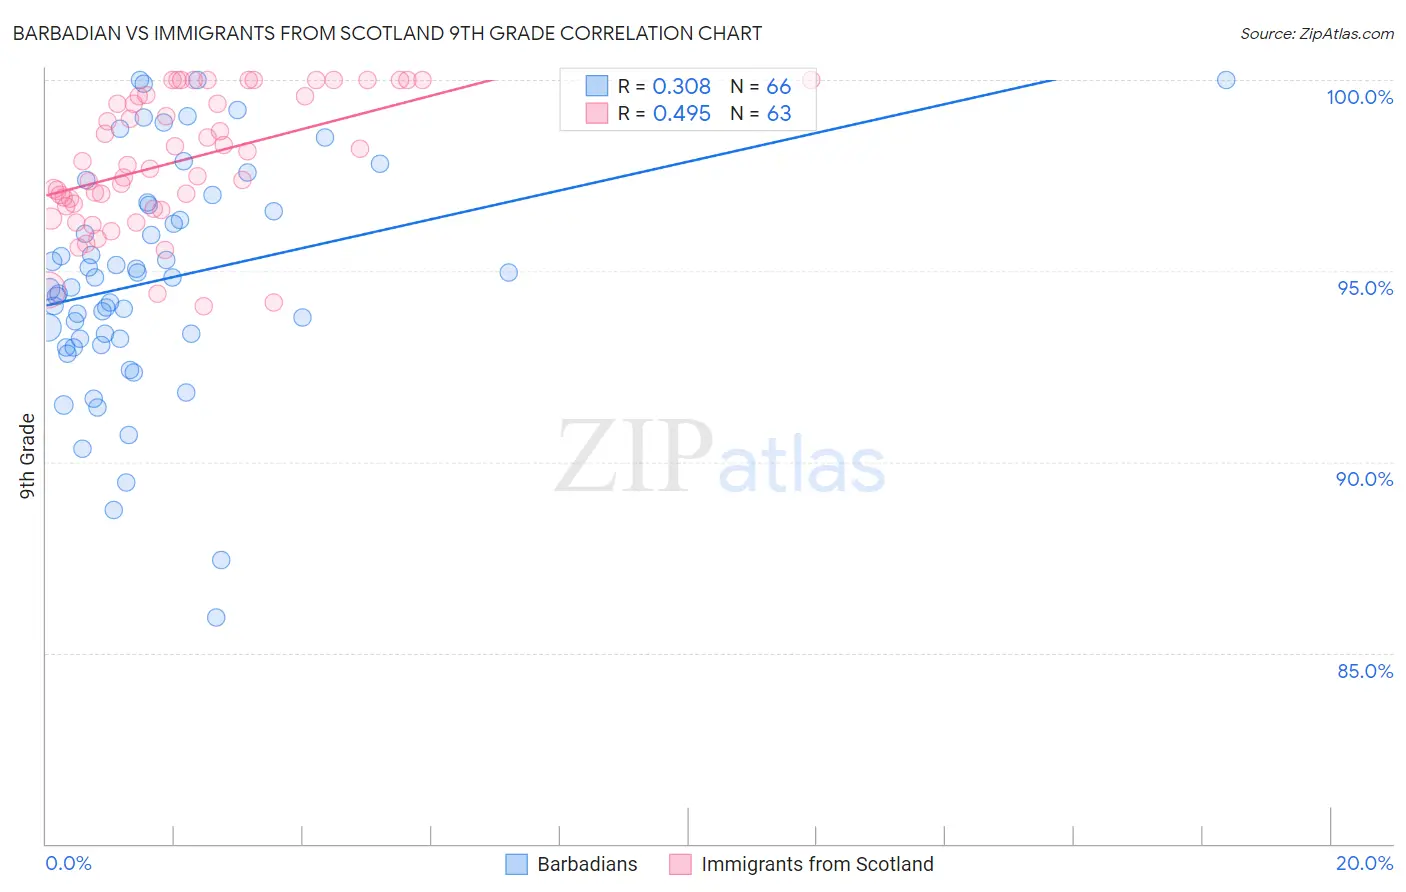
Barbadian vs Immigrants from Scotland 9th Grade Correlation Chart
The statistical analysis conducted on geographies consisting of 141,304,456 people shows a mild positive correlation between the proportion of Barbadians and percentage of population with at least 9th grade education in the United States with a correlation coefficient (R) of 0.308 and weighted average of 93.5%. Similarly, the statistical analysis conducted on geographies consisting of 196,394,967 people shows a moderate positive correlation between the proportion of Immigrants from Scotland and percentage of population with at least 9th grade education in the United States with a correlation coefficient (R) of 0.495 and weighted average of 96.1%, a difference of 2.8%.
9th Grade Correlation Summary
| Measurement | Barbadian | Immigrants from Scotland |
| Minimum | 85.9% | 94.1% |
| Maximum | 100.0% | 100.0% |
| Range | 14.1% | 5.9% |
| Mean | 94.7% | 97.9% |
| Median | 94.7% | 97.8% |
| Interquartile 25% (IQ1) | 93.2% | 96.7% |
| Interquartile 75% (IQ3) | 96.7% | 99.6% |
| Interquartile Range (IQR) | 3.5% | 2.9% |
| Standard Deviation (Sample) | 3.0% | 1.7% |
| Standard Deviation (Population) | 3.0% | 1.7% |
Similar Demographics by 9th Grade
Demographics Similar to Barbadians by 9th Grade
In terms of 9th grade, the demographic groups most similar to Barbadians are Malaysian (93.5%, a difference of 0.020%), Immigrants from Trinidad and Tobago (93.6%, a difference of 0.070%), Bangladeshi (93.4%, a difference of 0.070%), Taiwanese (93.6%, a difference of 0.11%), and Immigrants from Peru (93.4%, a difference of 0.11%).
| Demographics | Rating | Rank | 9th Grade |
| West Indians | 0.2 /100 | #276 | Tragic 93.7% |
| Immigrants | Philippines | 0.1 /100 | #277 | Tragic 93.7% |
| Immigrants | Eritrea | 0.1 /100 | #278 | Tragic 93.7% |
| Trinidadians and Tobagonians | 0.1 /100 | #279 | Tragic 93.7% |
| Taiwanese | 0.1 /100 | #280 | Tragic 93.6% |
| Immigrants | Trinidad and Tobago | 0.1 /100 | #281 | Tragic 93.6% |
| Malaysians | 0.0 /100 | #282 | Tragic 93.5% |
| Barbadians | 0.0 /100 | #283 | Tragic 93.5% |
| Bangladeshis | 0.0 /100 | #284 | Tragic 93.4% |
| Immigrants | Peru | 0.0 /100 | #285 | Tragic 93.4% |
| Immigrants | Barbados | 0.0 /100 | #286 | Tragic 93.4% |
| Immigrants | St. Vincent and the Grenadines | 0.0 /100 | #287 | Tragic 93.4% |
| Immigrants | South Eastern Asia | 0.0 /100 | #288 | Tragic 93.3% |
| Immigrants | West Indies | 0.0 /100 | #289 | Tragic 93.3% |
| Pennsylvania Germans | 0.0 /100 | #290 | Tragic 93.3% |
Demographics Similar to Immigrants from Scotland by 9th Grade
In terms of 9th grade, the demographic groups most similar to Immigrants from Scotland are Estonian (96.1%, a difference of 0.0%), Ottawa (96.1%, a difference of 0.020%), Northern European (96.2%, a difference of 0.040%), Slavic (96.1%, a difference of 0.040%), and Bulgarian (96.2%, a difference of 0.050%).
| Demographics | Rating | Rank | 9th Grade |
| British | 100.0 /100 | #31 | Exceptional 96.3% |
| Belgians | 100.0 /100 | #32 | Exceptional 96.3% |
| Luxembourgers | 100.0 /100 | #33 | Exceptional 96.3% |
| Hungarians | 100.0 /100 | #34 | Exceptional 96.2% |
| Bulgarians | 99.9 /100 | #35 | Exceptional 96.2% |
| Northern Europeans | 99.9 /100 | #36 | Exceptional 96.2% |
| Estonians | 99.9 /100 | #37 | Exceptional 96.1% |
| Immigrants | Scotland | 99.9 /100 | #38 | Exceptional 96.1% |
| Ottawa | 99.9 /100 | #39 | Exceptional 96.1% |
| Slavs | 99.9 /100 | #40 | Exceptional 96.1% |
| Czechoslovakians | 99.9 /100 | #41 | Exceptional 96.1% |
| Chippewa | 99.9 /100 | #42 | Exceptional 96.1% |
| Iranians | 99.9 /100 | #43 | Exceptional 96.1% |
| Alaska Natives | 99.9 /100 | #44 | Exceptional 96.1% |
| Crow | 99.9 /100 | #45 | Exceptional 96.1% |