Hungarian vs Immigrants from Scotland Single Father Poverty
COMPARE
Hungarian
Immigrants from Scotland
Single Father Poverty
Single Father Poverty Comparison
Hungarians
Immigrants from Scotland
18.5%
SINGLE FATHER POVERTY
0.0/ 100
METRIC RATING
301st/ 347
METRIC RANK
16.7%
SINGLE FATHER POVERTY
9.6/ 100
METRIC RATING
215th/ 347
METRIC RANK
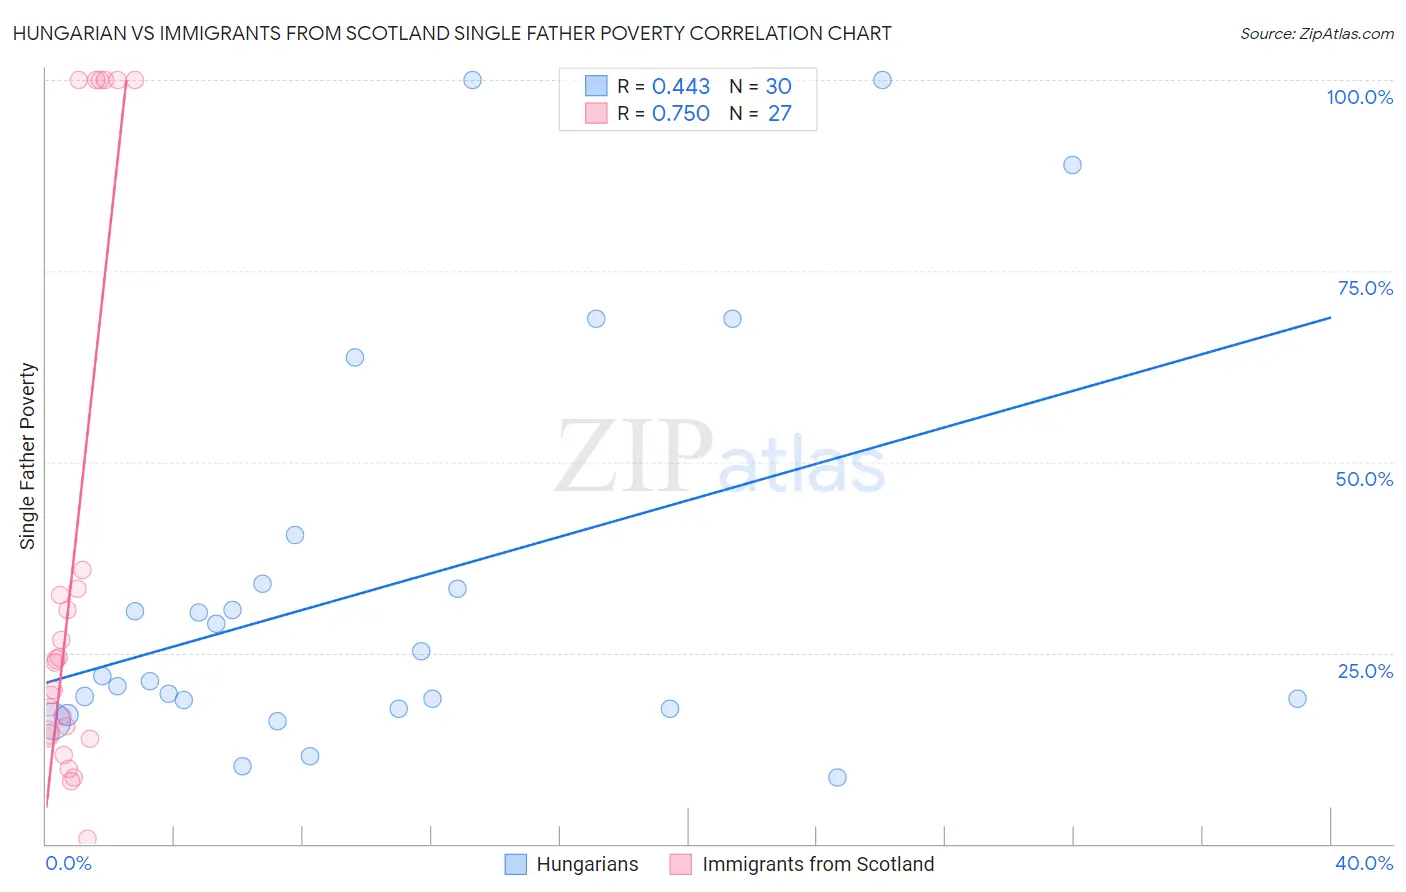
Hungarian vs Immigrants from Scotland Single Father Poverty Correlation Chart
The statistical analysis conducted on geographies consisting of 362,286,644 people shows a moderate positive correlation between the proportion of Hungarians and poverty level among single fathers in the United States with a correlation coefficient (R) of 0.443 and weighted average of 18.5%. Similarly, the statistical analysis conducted on geographies consisting of 163,789,782 people shows a strong positive correlation between the proportion of Immigrants from Scotland and poverty level among single fathers in the United States with a correlation coefficient (R) of 0.750 and weighted average of 16.7%, a difference of 10.5%.
Single Father Poverty Correlation Summary
| Measurement | Hungarian | Immigrants from Scotland |
| Minimum | 8.6% | 0.70% |
| Maximum | 100.0% | 100.0% |
| Range | 91.4% | 99.3% |
| Mean | 33.9% | 37.1% |
| Median | 21.6% | 23.7% |
| Interquartile 25% (IQ1) | 17.7% | 14.3% |
| Interquartile 75% (IQ3) | 34.0% | 35.9% |
| Interquartile Range (IQR) | 16.3% | 21.6% |
| Standard Deviation (Sample) | 26.2% | 35.2% |
| Standard Deviation (Population) | 25.8% | 34.6% |
Similar Demographics by Single Father Poverty
Demographics Similar to Hungarians by Single Father Poverty
In terms of single father poverty, the demographic groups most similar to Hungarians are Comanche (18.5%, a difference of 0.11%), Celtic (18.5%, a difference of 0.15%), Immigrants from Dominican Republic (18.4%, a difference of 0.22%), Ute (18.5%, a difference of 0.29%), and Blackfeet (18.5%, a difference of 0.34%).
| Demographics | Rating | Rank | Single Father Poverty |
| U.S. Virgin Islanders | 0.0 /100 | #294 | Tragic 18.1% |
| Yakama | 0.0 /100 | #295 | Tragic 18.1% |
| Seminole | 0.0 /100 | #296 | Tragic 18.1% |
| French | 0.0 /100 | #297 | Tragic 18.2% |
| Africans | 0.0 /100 | #298 | Tragic 18.3% |
| Whites/Caucasians | 0.0 /100 | #299 | Tragic 18.4% |
| Immigrants | Dominican Republic | 0.0 /100 | #300 | Tragic 18.4% |
| Hungarians | 0.0 /100 | #301 | Tragic 18.5% |
| Comanche | 0.0 /100 | #302 | Tragic 18.5% |
| Celtics | 0.0 /100 | #303 | Tragic 18.5% |
| Ute | 0.0 /100 | #304 | Tragic 18.5% |
| Blackfeet | 0.0 /100 | #305 | Tragic 18.5% |
| Scotch-Irish | 0.0 /100 | #306 | Tragic 18.6% |
| French Canadians | 0.0 /100 | #307 | Tragic 18.6% |
| Ottawa | 0.0 /100 | #308 | Tragic 18.6% |
Demographics Similar to Immigrants from Scotland by Single Father Poverty
In terms of single father poverty, the demographic groups most similar to Immigrants from Scotland are Immigrants from England (16.7%, a difference of 0.0%), Cheyenne (16.7%, a difference of 0.030%), Spanish (16.7%, a difference of 0.13%), Immigrants from Uganda (16.7%, a difference of 0.13%), and Ghanaian (16.7%, a difference of 0.17%).
| Demographics | Rating | Rank | Single Father Poverty |
| Eastern Europeans | 13.7 /100 | #208 | Poor 16.6% |
| Europeans | 13.2 /100 | #209 | Poor 16.6% |
| Guatemalans | 12.9 /100 | #210 | Poor 16.6% |
| Arabs | 12.8 /100 | #211 | Poor 16.6% |
| Immigrants | Southern Europe | 11.2 /100 | #212 | Poor 16.7% |
| Ghanaians | 11.0 /100 | #213 | Poor 16.7% |
| Spanish | 10.7 /100 | #214 | Poor 16.7% |
| Immigrants | Scotland | 9.6 /100 | #215 | Tragic 16.7% |
| Immigrants | England | 9.5 /100 | #216 | Tragic 16.7% |
| Cheyenne | 9.3 /100 | #217 | Tragic 16.7% |
| Immigrants | Uganda | 8.6 /100 | #218 | Tragic 16.7% |
| Immigrants | Ghana | 8.1 /100 | #219 | Tragic 16.7% |
| Immigrants | Denmark | 8.1 /100 | #220 | Tragic 16.7% |
| Immigrants | Greece | 8.1 /100 | #221 | Tragic 16.7% |
| Immigrants | Spain | 8.0 /100 | #222 | Tragic 16.7% |