Barbadian vs Immigrants from Scotland Male Disability
COMPARE
Barbadian
Immigrants from Scotland
Male Disability
Male Disability Comparison
Barbadians
Immigrants from Scotland
11.2%
MALE DISABILITY
53.4/ 100
METRIC RATING
169th/ 347
METRIC RANK
11.6%
MALE DISABILITY
8.2/ 100
METRIC RATING
212th/ 347
METRIC RANK
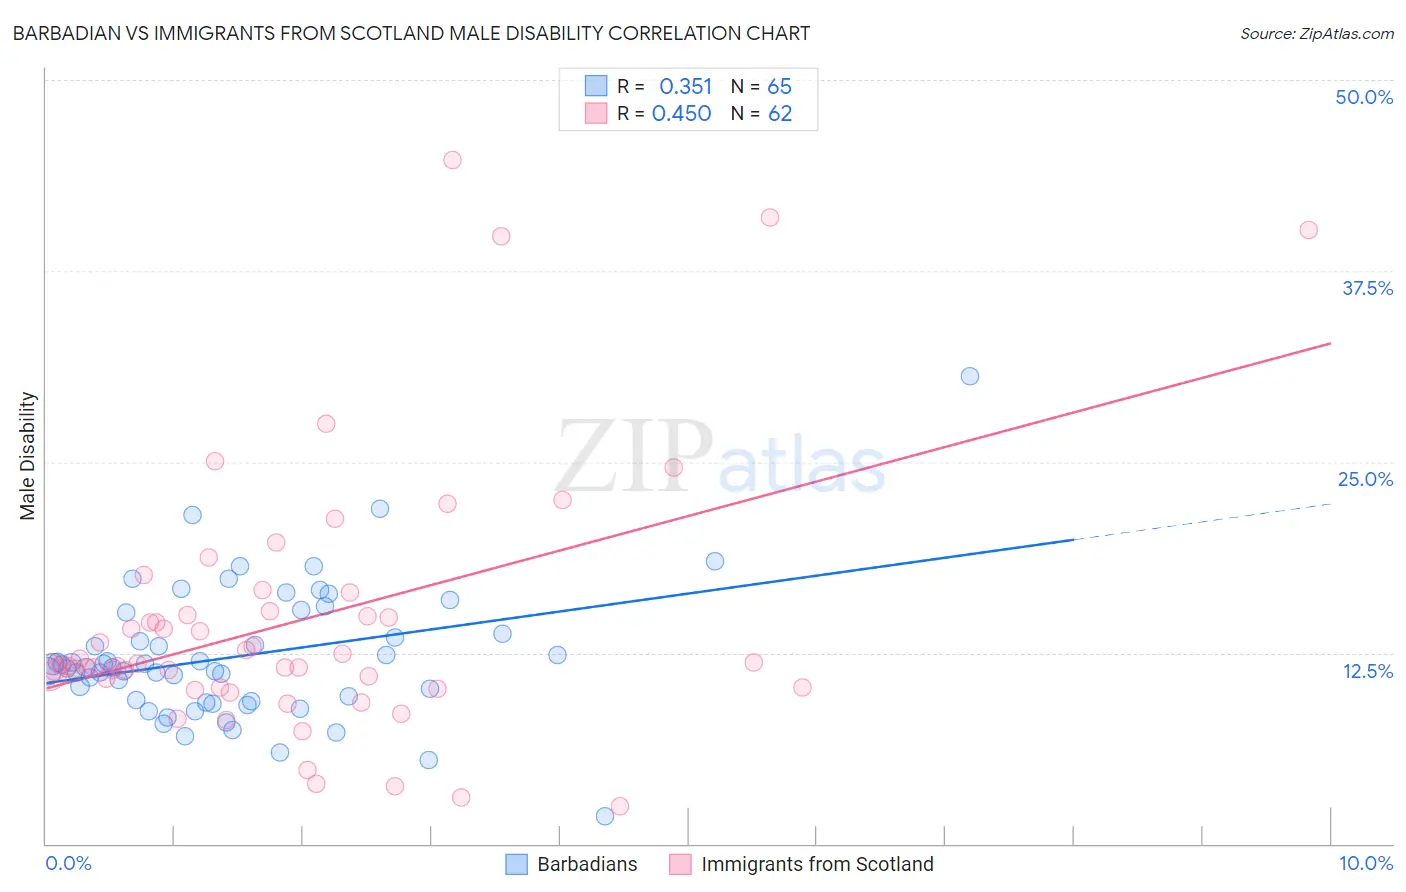
Barbadian vs Immigrants from Scotland Male Disability Correlation Chart
The statistical analysis conducted on geographies consisting of 141,288,845 people shows a mild positive correlation between the proportion of Barbadians and percentage of males with a disability in the United States with a correlation coefficient (R) of 0.351 and weighted average of 11.2%. Similarly, the statistical analysis conducted on geographies consisting of 196,397,842 people shows a moderate positive correlation between the proportion of Immigrants from Scotland and percentage of males with a disability in the United States with a correlation coefficient (R) of 0.450 and weighted average of 11.6%, a difference of 3.5%.
Male Disability Correlation Summary
| Measurement | Barbadian | Immigrants from Scotland |
| Minimum | 1.8% | 2.5% |
| Maximum | 30.6% | 44.8% |
| Range | 28.8% | 42.3% |
| Mean | 12.3% | 14.6% |
| Median | 11.6% | 11.7% |
| Interquartile 25% (IQ1) | 9.3% | 10.3% |
| Interquartile 75% (IQ3) | 14.4% | 15.2% |
| Interquartile Range (IQR) | 5.1% | 5.0% |
| Standard Deviation (Sample) | 4.4% | 8.7% |
| Standard Deviation (Population) | 4.4% | 8.6% |
Similar Demographics by Male Disability
Demographics Similar to Barbadians by Male Disability
In terms of male disability, the demographic groups most similar to Barbadians are Immigrants from Latin America (11.2%, a difference of 0.030%), New Zealander (11.2%, a difference of 0.030%), Haitian (11.2%, a difference of 0.050%), Immigrants from Southern Europe (11.2%, a difference of 0.060%), and Romanian (11.2%, a difference of 0.15%).
| Demographics | Rating | Rank | Male Disability |
| Immigrants | Haiti | 65.3 /100 | #162 | Good 11.1% |
| Immigrants | Kenya | 63.8 /100 | #163 | Good 11.1% |
| British West Indians | 62.8 /100 | #164 | Good 11.1% |
| Luxembourgers | 61.9 /100 | #165 | Good 11.1% |
| Immigrants | Hungary | 61.2 /100 | #166 | Good 11.1% |
| Immigrants | Southern Europe | 54.4 /100 | #167 | Average 11.2% |
| Immigrants | Latin America | 54.0 /100 | #168 | Average 11.2% |
| Barbadians | 53.4 /100 | #169 | Average 11.2% |
| New Zealanders | 52.9 /100 | #170 | Average 11.2% |
| Haitians | 52.5 /100 | #171 | Average 11.2% |
| Romanians | 50.7 /100 | #172 | Average 11.2% |
| Immigrants | Burma/Myanmar | 50.4 /100 | #173 | Average 11.2% |
| Maltese | 50.0 /100 | #174 | Average 11.2% |
| Immigrants | Honduras | 48.7 /100 | #175 | Average 11.2% |
| Syrians | 46.6 /100 | #176 | Average 11.2% |
Demographics Similar to Immigrants from Scotland by Male Disability
In terms of male disability, the demographic groups most similar to Immigrants from Scotland are Immigrants from Thailand (11.6%, a difference of 0.030%), Mexican American Indian (11.6%, a difference of 0.080%), Ute (11.6%, a difference of 0.20%), Spanish American Indian (11.6%, a difference of 0.30%), and Icelander (11.6%, a difference of 0.31%).
| Demographics | Rating | Rank | Male Disability |
| Serbians | 10.7 /100 | #205 | Poor 11.5% |
| Ukrainians | 10.6 /100 | #206 | Poor 11.5% |
| Immigrants | Somalia | 10.4 /100 | #207 | Poor 11.5% |
| Icelanders | 10.1 /100 | #208 | Poor 11.6% |
| Spanish American Indians | 10.1 /100 | #209 | Poor 11.6% |
| Ute | 9.4 /100 | #210 | Tragic 11.6% |
| Immigrants | Thailand | 8.4 /100 | #211 | Tragic 11.6% |
| Immigrants | Scotland | 8.2 /100 | #212 | Tragic 11.6% |
| Mexican American Indians | 7.8 /100 | #213 | Tragic 11.6% |
| Lithuanians | 6.6 /100 | #214 | Tragic 11.6% |
| Indonesians | 5.9 /100 | #215 | Tragic 11.6% |
| Immigrants | Dominican Republic | 4.9 /100 | #216 | Tragic 11.7% |
| Immigrants | Dominica | 4.6 /100 | #217 | Tragic 11.7% |
| Immigrants | England | 4.0 /100 | #218 | Tragic 11.7% |
| Panamanians | 3.8 /100 | #219 | Tragic 11.7% |