Creek vs Hungarian Single Mother Poverty
COMPARE
Creek
Hungarian
Single Mother Poverty
Single Mother Poverty Comparison
Creek
Hungarians
36.7%
SINGLE MOTHER POVERTY
0.0/ 100
METRIC RATING
331st/ 347
METRIC RANK
29.9%
SINGLE MOTHER POVERTY
10.3/ 100
METRIC RATING
218th/ 347
METRIC RANK
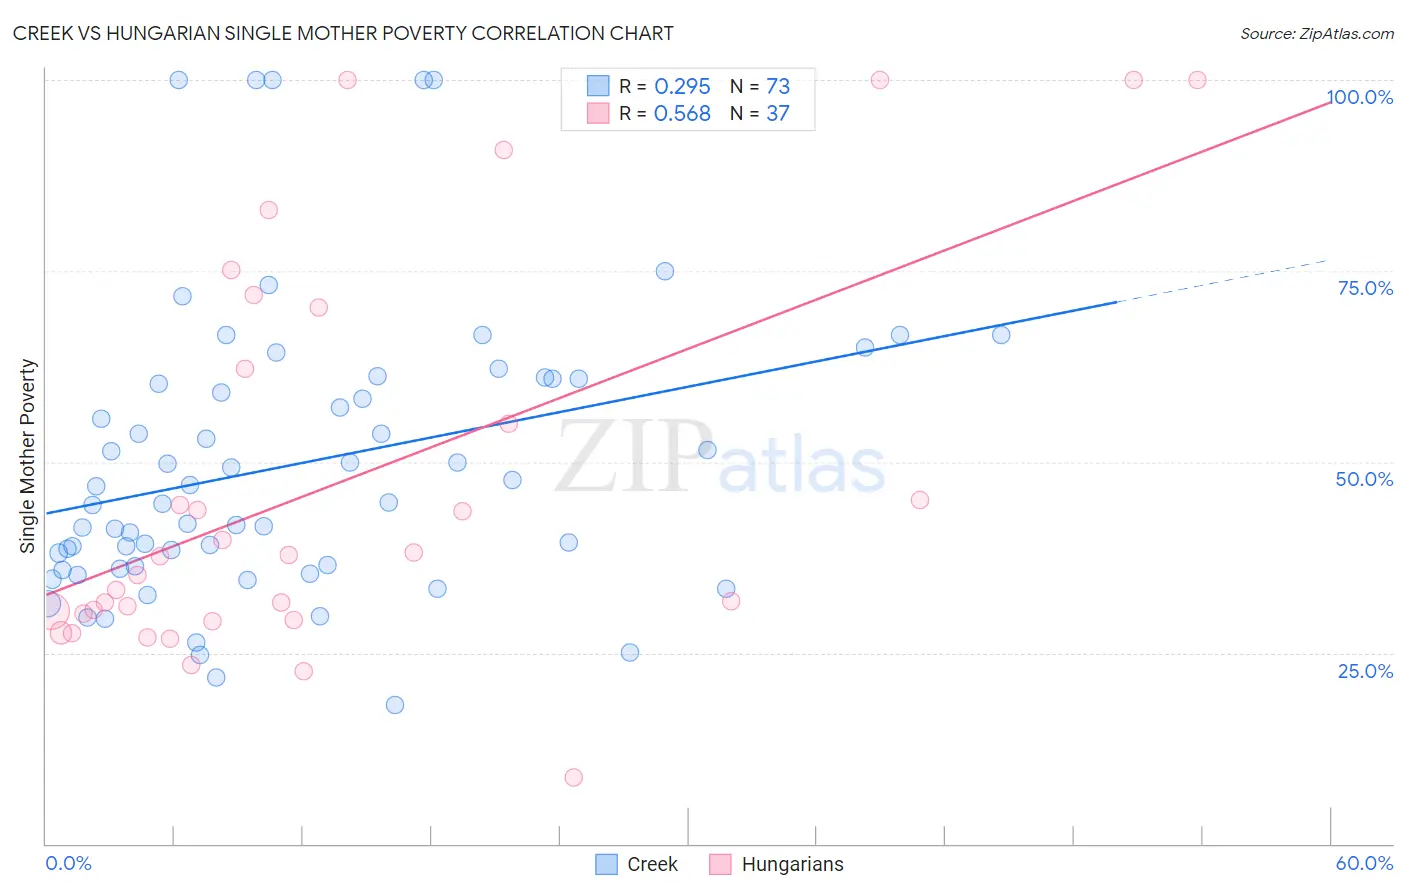
Creek vs Hungarian Single Mother Poverty Correlation Chart
The statistical analysis conducted on geographies consisting of 177,086,597 people shows a weak positive correlation between the proportion of Creek and poverty level among single mothers in the United States with a correlation coefficient (R) of 0.295 and weighted average of 36.7%. Similarly, the statistical analysis conducted on geographies consisting of 467,495,531 people shows a substantial positive correlation between the proportion of Hungarians and poverty level among single mothers in the United States with a correlation coefficient (R) of 0.568 and weighted average of 29.9%, a difference of 22.6%.
Single Mother Poverty Correlation Summary
| Measurement | Creek | Hungarian |
| Minimum | 18.2% | 8.6% |
| Maximum | 100.0% | 100.0% |
| Range | 81.8% | 91.4% |
| Mean | 49.7% | 47.2% |
| Median | 44.7% | 37.6% |
| Interquartile 25% (IQ1) | 36.1% | 29.7% |
| Interquartile 75% (IQ3) | 60.9% | 66.3% |
| Interquartile Range (IQR) | 24.8% | 36.6% |
| Standard Deviation (Sample) | 19.0% | 25.8% |
| Standard Deviation (Population) | 18.9% | 25.5% |
Similar Demographics by Single Mother Poverty
Demographics Similar to Creek by Single Mother Poverty
In terms of single mother poverty, the demographic groups most similar to Creek are Native/Alaskan (36.6%, a difference of 0.16%), Dutch West Indian (36.8%, a difference of 0.24%), Apache (36.6%, a difference of 0.26%), Choctaw (36.4%, a difference of 0.74%), and Yakama (36.4%, a difference of 0.79%).
| Demographics | Rating | Rank | Single Mother Poverty |
| Ottawa | 0.0 /100 | #324 | Tragic 35.5% |
| Ute | 0.0 /100 | #325 | Tragic 35.7% |
| Seminole | 0.0 /100 | #326 | Tragic 35.8% |
| Yakama | 0.0 /100 | #327 | Tragic 36.4% |
| Choctaw | 0.0 /100 | #328 | Tragic 36.4% |
| Apache | 0.0 /100 | #329 | Tragic 36.6% |
| Natives/Alaskans | 0.0 /100 | #330 | Tragic 36.6% |
| Creek | 0.0 /100 | #331 | Tragic 36.7% |
| Dutch West Indians | 0.0 /100 | #332 | Tragic 36.8% |
| Menominee | 0.0 /100 | #333 | Tragic 37.1% |
| Pueblo | 0.0 /100 | #334 | Tragic 37.2% |
| Yuman | 0.0 /100 | #335 | Tragic 37.8% |
| Cheyenne | 0.0 /100 | #336 | Tragic 38.5% |
| Immigrants | Yemen | 0.0 /100 | #337 | Tragic 38.5% |
| Pima | 0.0 /100 | #338 | Tragic 38.6% |
Demographics Similar to Hungarians by Single Mother Poverty
In terms of single mother poverty, the demographic groups most similar to Hungarians are Immigrants from Ghana (29.9%, a difference of 0.12%), Immigrants from Western Africa (29.9%, a difference of 0.14%), Finnish (30.0%, a difference of 0.14%), Liberian (29.9%, a difference of 0.16%), and Jamaican (29.9%, a difference of 0.16%).
| Demographics | Rating | Rank | Single Mother Poverty |
| Guyanese | 12.8 /100 | #211 | Poor 29.8% |
| Nicaraguans | 12.4 /100 | #212 | Poor 29.8% |
| Immigrants | Thailand | 12.0 /100 | #213 | Poor 29.9% |
| Liberians | 11.7 /100 | #214 | Poor 29.9% |
| Jamaicans | 11.7 /100 | #215 | Poor 29.9% |
| Immigrants | Western Africa | 11.5 /100 | #216 | Poor 29.9% |
| Immigrants | Ghana | 11.3 /100 | #217 | Poor 29.9% |
| Hungarians | 10.3 /100 | #218 | Poor 29.9% |
| Finns | 9.3 /100 | #219 | Tragic 30.0% |
| Germans | 8.8 /100 | #220 | Tragic 30.0% |
| Immigrants | Eritrea | 7.7 /100 | #221 | Tragic 30.0% |
| Sudanese | 7.6 /100 | #222 | Tragic 30.0% |
| Immigrants | Cuba | 6.9 /100 | #223 | Tragic 30.1% |
| Immigrants | Sudan | 6.5 /100 | #224 | Tragic 30.1% |
| Spanish | 6.3 /100 | #225 | Tragic 30.1% |