Assyrian/Chaldean/Syriac vs Immigrants from Cameroon 3rd Grade
COMPARE
Assyrian/Chaldean/Syriac
Immigrants from Cameroon
3rd Grade
3rd Grade Comparison
Assyrians/Chaldeans/Syriacs
Immigrants from Cameroon
97.4%
3RD GRADE
1.0/ 100
METRIC RATING
247th/ 347
METRIC RANK
97.2%
3RD GRADE
0.1/ 100
METRIC RATING
274th/ 347
METRIC RANK
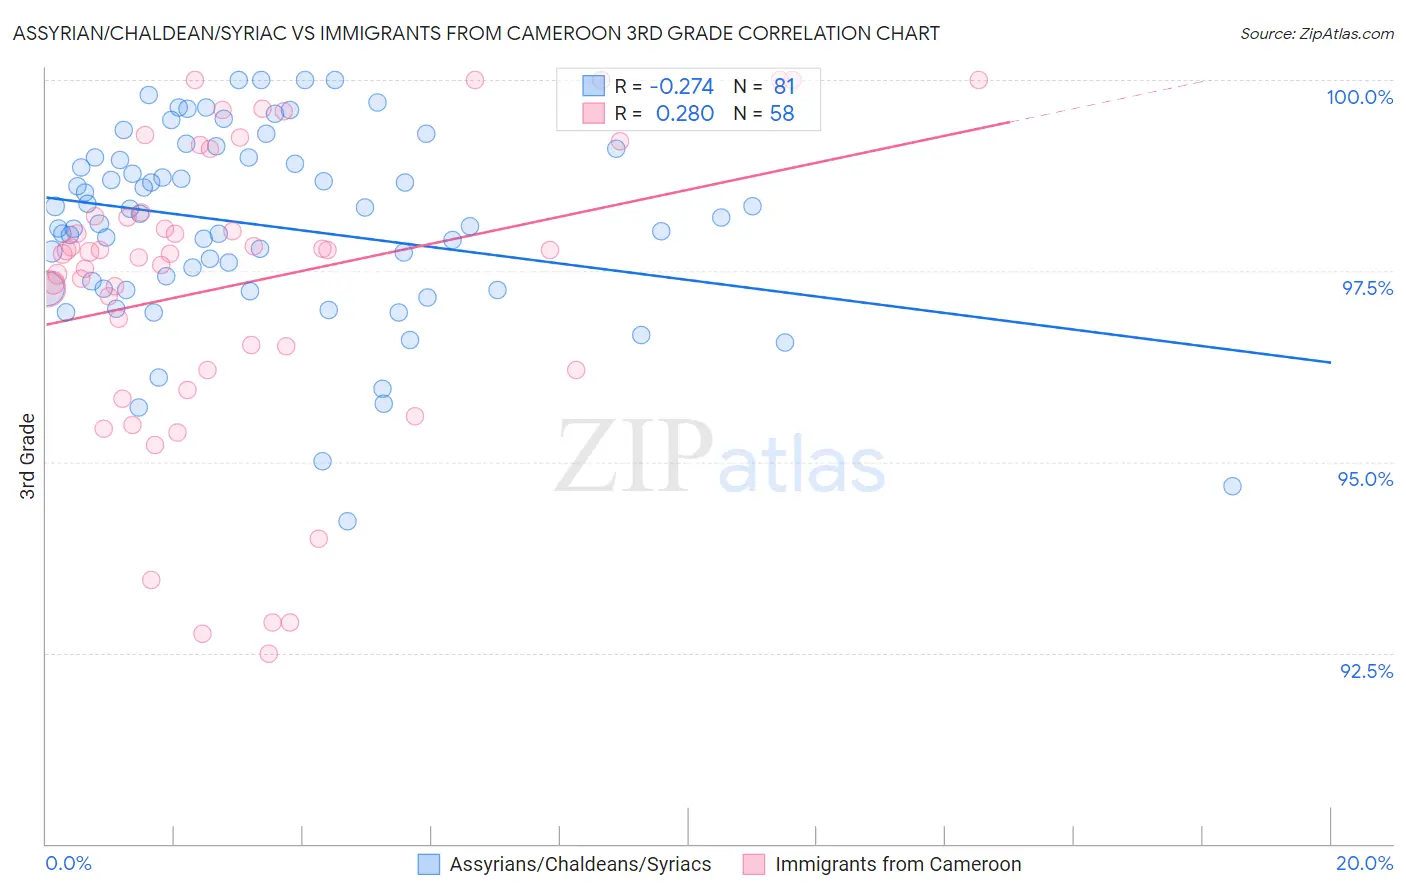
Assyrian/Chaldean/Syriac vs Immigrants from Cameroon 3rd Grade Correlation Chart
The statistical analysis conducted on geographies consisting of 110,318,304 people shows a weak negative correlation between the proportion of Assyrians/Chaldeans/Syriacs and percentage of population with at least 3rd grade education in the United States with a correlation coefficient (R) of -0.274 and weighted average of 97.4%. Similarly, the statistical analysis conducted on geographies consisting of 130,752,798 people shows a weak positive correlation between the proportion of Immigrants from Cameroon and percentage of population with at least 3rd grade education in the United States with a correlation coefficient (R) of 0.280 and weighted average of 97.2%, a difference of 0.17%.
3rd Grade Correlation Summary
| Measurement | Assyrian/Chaldean/Syriac | Immigrants from Cameroon |
| Minimum | 94.2% | 92.5% |
| Maximum | 100.0% | 100.0% |
| Range | 5.8% | 7.5% |
| Mean | 98.1% | 97.3% |
| Median | 98.2% | 97.7% |
| Interquartile 25% (IQ1) | 97.3% | 96.2% |
| Interquartile 75% (IQ3) | 99.0% | 98.3% |
| Interquartile Range (IQR) | 1.7% | 2.1% |
| Standard Deviation (Sample) | 1.3% | 2.0% |
| Standard Deviation (Population) | 1.2% | 1.9% |
Similar Demographics by 3rd Grade
Demographics Similar to Assyrians/Chaldeans/Syriacs by 3rd Grade
In terms of 3rd grade, the demographic groups most similar to Assyrians/Chaldeans/Syriacs are Immigrants from Senegal (97.4%, a difference of 0.0%), Immigrants from Eastern Africa (97.4%, a difference of 0.0%), Asian (97.4%, a difference of 0.010%), Ethiopian (97.4%, a difference of 0.010%), and South American (97.4%, a difference of 0.010%).
| Demographics | Rating | Rank | 3rd Grade |
| U.S. Virgin Islanders | 1.4 /100 | #240 | Tragic 97.4% |
| Immigrants | Indonesia | 1.4 /100 | #241 | Tragic 97.4% |
| Koreans | 1.3 /100 | #242 | Tragic 97.4% |
| Indians (Asian) | 1.3 /100 | #243 | Tragic 97.4% |
| Asians | 1.1 /100 | #244 | Tragic 97.4% |
| Ethiopians | 1.1 /100 | #245 | Tragic 97.4% |
| Immigrants | Senegal | 1.0 /100 | #246 | Tragic 97.4% |
| Assyrians/Chaldeans/Syriacs | 1.0 /100 | #247 | Tragic 97.4% |
| Immigrants | Eastern Africa | 0.9 /100 | #248 | Tragic 97.4% |
| South Americans | 0.9 /100 | #249 | Tragic 97.4% |
| Immigrants | Middle Africa | 0.9 /100 | #250 | Tragic 97.4% |
| Immigrants | Asia | 0.8 /100 | #251 | Tragic 97.4% |
| Peruvians | 0.8 /100 | #252 | Tragic 97.4% |
| Immigrants | Africa | 0.8 /100 | #253 | Tragic 97.4% |
| Jamaicans | 0.7 /100 | #254 | Tragic 97.4% |
Demographics Similar to Immigrants from Cameroon by 3rd Grade
In terms of 3rd grade, the demographic groups most similar to Immigrants from Cameroon are Immigrants from China (97.2%, a difference of 0.010%), Puerto Rican (97.2%, a difference of 0.010%), Ghanaian (97.2%, a difference of 0.010%), Immigrants from Peru (97.2%, a difference of 0.010%), and Immigrants from Uzbekistan (97.2%, a difference of 0.020%).
| Demographics | Rating | Rank | 3rd Grade |
| Immigrants | Nigeria | 0.3 /100 | #267 | Tragic 97.3% |
| Cubans | 0.2 /100 | #268 | Tragic 97.3% |
| Fijians | 0.2 /100 | #269 | Tragic 97.3% |
| Immigrants | China | 0.2 /100 | #270 | Tragic 97.2% |
| Puerto Ricans | 0.2 /100 | #271 | Tragic 97.2% |
| Ghanaians | 0.1 /100 | #272 | Tragic 97.2% |
| Immigrants | Peru | 0.1 /100 | #273 | Tragic 97.2% |
| Immigrants | Cameroon | 0.1 /100 | #274 | Tragic 97.2% |
| Immigrants | Uzbekistan | 0.1 /100 | #275 | Tragic 97.2% |
| Immigrants | Bolivia | 0.1 /100 | #276 | Tragic 97.2% |
| Trinidadians and Tobagonians | 0.1 /100 | #277 | Tragic 97.2% |
| Immigrants | Western Africa | 0.1 /100 | #278 | Tragic 97.2% |
| Immigrants | Philippines | 0.1 /100 | #279 | Tragic 97.2% |
| Immigrants | Ghana | 0.1 /100 | #280 | Tragic 97.2% |
| Barbadians | 0.1 /100 | #281 | Tragic 97.2% |