Assyrian/Chaldean/Syriac vs Immigrants from Cameroon Male Disability
COMPARE
Assyrian/Chaldean/Syriac
Immigrants from Cameroon
Male Disability
Male Disability Comparison
Assyrians/Chaldeans/Syriacs
Immigrants from Cameroon
11.4%
MALE DISABILITY
23.2/ 100
METRIC RATING
192nd/ 347
METRIC RANK
10.5%
MALE DISABILITY
99.0/ 100
METRIC RATING
71st/ 347
METRIC RANK
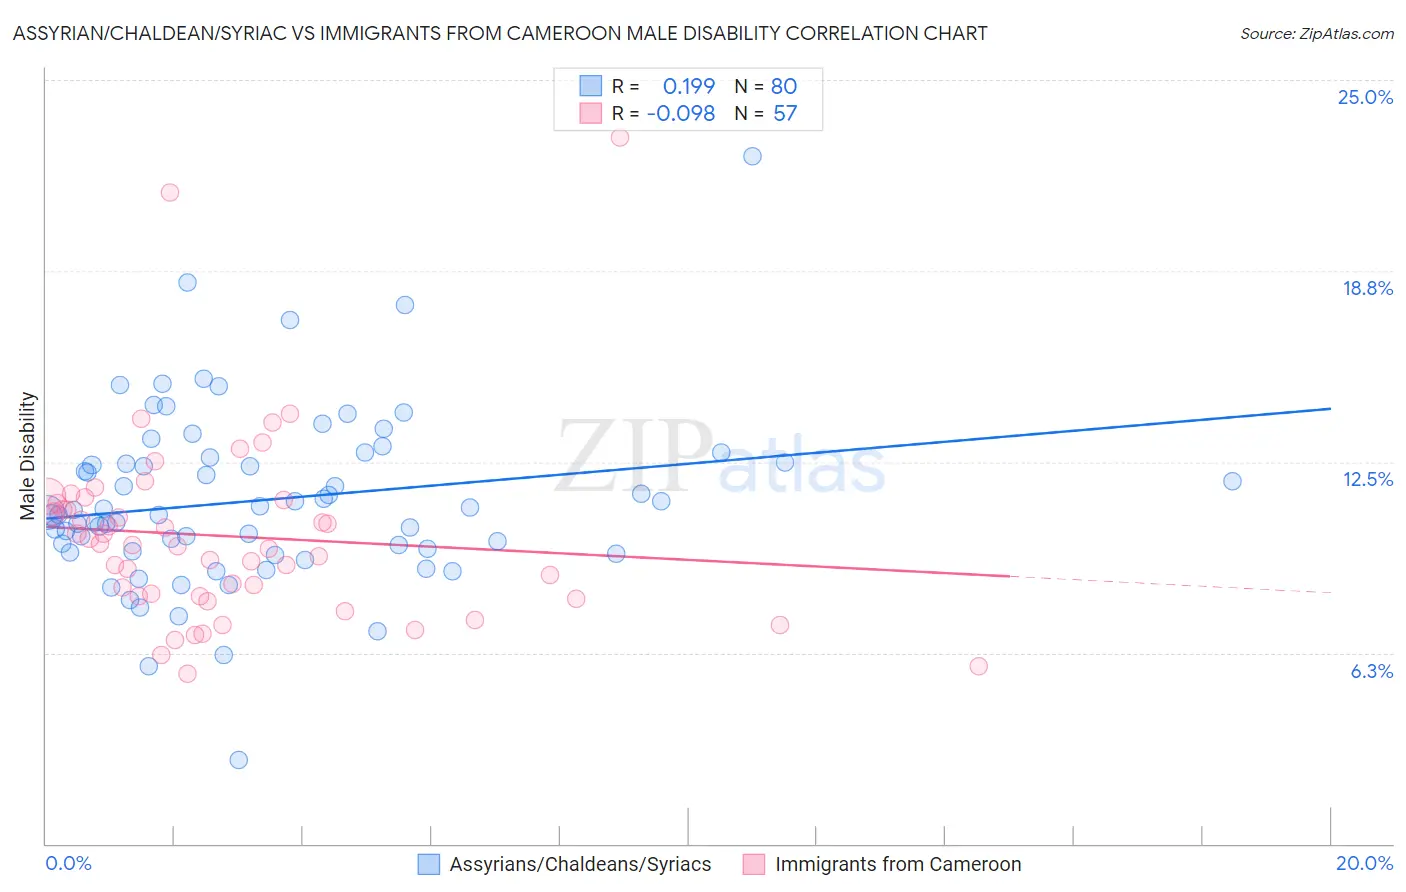
Assyrian/Chaldean/Syriac vs Immigrants from Cameroon Male Disability Correlation Chart
The statistical analysis conducted on geographies consisting of 110,312,508 people shows a poor positive correlation between the proportion of Assyrians/Chaldeans/Syriacs and percentage of males with a disability in the United States with a correlation coefficient (R) of 0.199 and weighted average of 11.4%. Similarly, the statistical analysis conducted on geographies consisting of 130,760,441 people shows a slight negative correlation between the proportion of Immigrants from Cameroon and percentage of males with a disability in the United States with a correlation coefficient (R) of -0.098 and weighted average of 10.5%, a difference of 8.6%.
Male Disability Correlation Summary
| Measurement | Assyrian/Chaldean/Syriac | Immigrants from Cameroon |
| Minimum | 2.8% | 5.6% |
| Maximum | 22.5% | 23.1% |
| Range | 19.7% | 17.6% |
| Mean | 11.3% | 10.1% |
| Median | 10.9% | 9.8% |
| Interquartile 25% (IQ1) | 9.6% | 8.1% |
| Interquartile 75% (IQ3) | 12.6% | 11.2% |
| Interquartile Range (IQR) | 3.0% | 3.1% |
| Standard Deviation (Sample) | 2.9% | 3.1% |
| Standard Deviation (Population) | 2.9% | 3.1% |
Similar Demographics by Male Disability
Demographics Similar to Assyrians/Chaldeans/Syriacs by Male Disability
In terms of male disability, the demographic groups most similar to Assyrians/Chaldeans/Syriacs are Senegalese (11.4%, a difference of 0.0%), Greek (11.4%, a difference of 0.070%), Belizean (11.4%, a difference of 0.15%), Immigrants from Bosnia and Herzegovina (11.4%, a difference of 0.16%), and Immigrants from Oceania (11.4%, a difference of 0.18%).
| Demographics | Rating | Rank | Male Disability |
| Pakistanis | 30.3 /100 | #185 | Fair 11.3% |
| Immigrants | Zaire | 27.6 /100 | #186 | Fair 11.4% |
| Immigrants | Austria | 27.3 /100 | #187 | Fair 11.4% |
| Estonians | 26.8 /100 | #188 | Fair 11.4% |
| Immigrants | Netherlands | 25.9 /100 | #189 | Fair 11.4% |
| Immigrants | Bosnia and Herzegovina | 25.4 /100 | #190 | Fair 11.4% |
| Senegalese | 23.2 /100 | #191 | Fair 11.4% |
| Assyrians/Chaldeans/Syriacs | 23.2 /100 | #192 | Fair 11.4% |
| Greeks | 22.2 /100 | #193 | Fair 11.4% |
| Belizeans | 21.2 /100 | #194 | Fair 11.4% |
| Immigrants | Oceania | 20.9 /100 | #195 | Fair 11.4% |
| West Indians | 18.4 /100 | #196 | Poor 11.4% |
| Somalis | 18.2 /100 | #197 | Poor 11.4% |
| Immigrants | Jamaica | 16.3 /100 | #198 | Poor 11.5% |
| Lebanese | 15.4 /100 | #199 | Poor 11.5% |
Demographics Similar to Immigrants from Cameroon by Male Disability
In terms of male disability, the demographic groups most similar to Immigrants from Cameroon are Immigrants from Serbia (10.5%, a difference of 0.060%), Immigrants from Lithuania (10.5%, a difference of 0.12%), Immigrants from Bulgaria (10.5%, a difference of 0.15%), Immigrants from Lebanon (10.5%, a difference of 0.26%), and Colombian (10.5%, a difference of 0.29%).
| Demographics | Rating | Rank | Male Disability |
| Jordanians | 99.3 /100 | #64 | Exceptional 10.5% |
| Immigrants | Grenada | 99.2 /100 | #65 | Exceptional 10.5% |
| Guyanese | 99.2 /100 | #66 | Exceptional 10.5% |
| Immigrants | Afghanistan | 99.2 /100 | #67 | Exceptional 10.5% |
| Colombians | 99.2 /100 | #68 | Exceptional 10.5% |
| Ecuadorians | 99.2 /100 | #69 | Exceptional 10.5% |
| Immigrants | Bulgaria | 99.1 /100 | #70 | Exceptional 10.5% |
| Immigrants | Cameroon | 99.0 /100 | #71 | Exceptional 10.5% |
| Immigrants | Serbia | 99.0 /100 | #72 | Exceptional 10.5% |
| Immigrants | Lithuania | 98.9 /100 | #73 | Exceptional 10.5% |
| Immigrants | Lebanon | 98.8 /100 | #74 | Exceptional 10.5% |
| Sierra Leoneans | 98.7 /100 | #75 | Exceptional 10.5% |
| Immigrants | Sierra Leone | 98.7 /100 | #76 | Exceptional 10.5% |
| Laotians | 98.6 /100 | #77 | Exceptional 10.6% |
| Immigrants | Russia | 98.6 /100 | #78 | Exceptional 10.6% |