Immigrants from Burma/Myanmar vs Immigrants from Cameroon Single Father Poverty
COMPARE
Immigrants from Burma/Myanmar
Immigrants from Cameroon
Single Father Poverty
Single Father Poverty Comparison
Immigrants from Burma/Myanmar
Immigrants from Cameroon
16.5%
SINGLE FATHER POVERTY
28.0/ 100
METRIC RATING
190th/ 347
METRIC RANK
15.2%
SINGLE FATHER POVERTY
99.7/ 100
METRIC RATING
68th/ 347
METRIC RANK
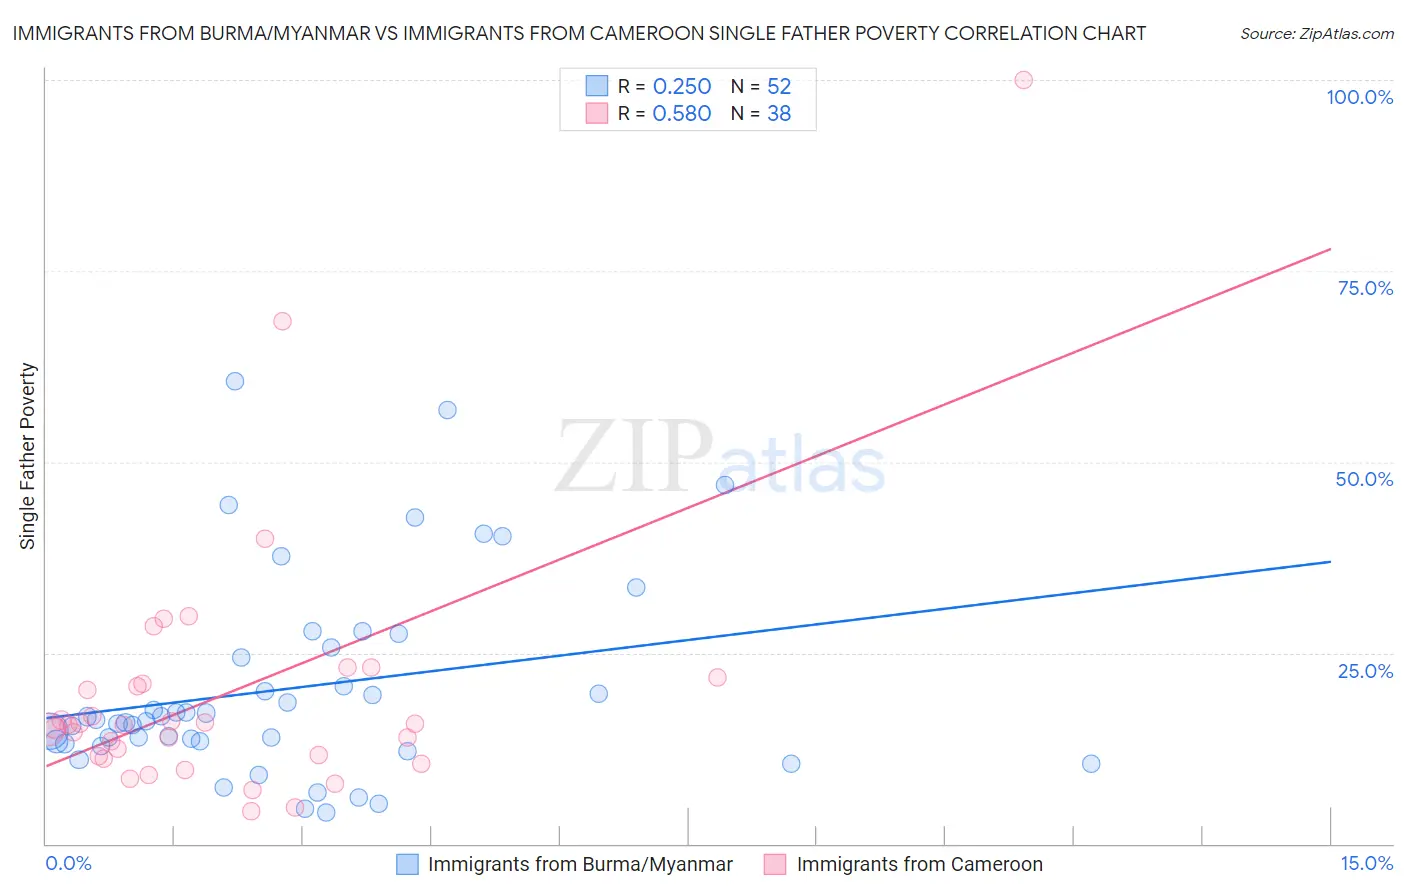
Immigrants from Burma/Myanmar vs Immigrants from Cameroon Single Father Poverty Correlation Chart
The statistical analysis conducted on geographies consisting of 151,197,682 people shows a weak positive correlation between the proportion of Immigrants from Burma/Myanmar and poverty level among single fathers in the United States with a correlation coefficient (R) of 0.250 and weighted average of 16.5%. Similarly, the statistical analysis conducted on geographies consisting of 118,461,150 people shows a substantial positive correlation between the proportion of Immigrants from Cameroon and poverty level among single fathers in the United States with a correlation coefficient (R) of 0.580 and weighted average of 15.2%, a difference of 8.1%.
Single Father Poverty Correlation Summary
| Measurement | Immigrants from Burma/Myanmar | Immigrants from Cameroon |
| Minimum | 4.1% | 4.2% |
| Maximum | 60.6% | 100.0% |
| Range | 56.5% | 95.8% |
| Mean | 20.3% | 19.7% |
| Median | 16.1% | 15.6% |
| Interquartile 25% (IQ1) | 13.3% | 11.5% |
| Interquartile 75% (IQ3) | 25.0% | 20.9% |
| Interquartile Range (IQR) | 11.8% | 9.4% |
| Standard Deviation (Sample) | 13.0% | 17.5% |
| Standard Deviation (Population) | 12.9% | 17.2% |
Similar Demographics by Single Father Poverty
Demographics Similar to Immigrants from Burma/Myanmar by Single Father Poverty
In terms of single father poverty, the demographic groups most similar to Immigrants from Burma/Myanmar are Latvian (16.5%, a difference of 0.050%), Immigrants from Guyana (16.5%, a difference of 0.050%), Russian (16.4%, a difference of 0.11%), Ukrainian (16.4%, a difference of 0.12%), and Immigrants from Venezuela (16.4%, a difference of 0.16%).
| Demographics | Rating | Rank | Single Father Poverty |
| Aleuts | 35.3 /100 | #183 | Fair 16.4% |
| Cambodians | 34.6 /100 | #184 | Fair 16.4% |
| Panamanians | 33.6 /100 | #185 | Fair 16.4% |
| Immigrants | Venezuela | 31.0 /100 | #186 | Fair 16.4% |
| Ukrainians | 30.4 /100 | #187 | Fair 16.4% |
| Russians | 30.1 /100 | #188 | Fair 16.4% |
| Latvians | 28.9 /100 | #189 | Fair 16.5% |
| Immigrants | Burma/Myanmar | 28.0 /100 | #190 | Fair 16.5% |
| Immigrants | Guyana | 27.1 /100 | #191 | Fair 16.5% |
| Immigrants | Switzerland | 24.8 /100 | #192 | Fair 16.5% |
| Ecuadorians | 24.5 /100 | #193 | Fair 16.5% |
| Cape Verdeans | 24.4 /100 | #194 | Fair 16.5% |
| Immigrants | Barbados | 24.3 /100 | #195 | Fair 16.5% |
| Immigrants | Canada | 21.9 /100 | #196 | Fair 16.5% |
| Immigrants | Northern Europe | 20.3 /100 | #197 | Fair 16.5% |
Demographics Similar to Immigrants from Cameroon by Single Father Poverty
In terms of single father poverty, the demographic groups most similar to Immigrants from Cameroon are Japanese (15.2%, a difference of 0.030%), Paraguayan (15.2%, a difference of 0.090%), Mongolian (15.3%, a difference of 0.13%), Immigrants from Moldova (15.2%, a difference of 0.18%), and Immigrants from Malaysia (15.2%, a difference of 0.20%).
| Demographics | Rating | Rank | Single Father Poverty |
| Immigrants | Bosnia and Herzegovina | 99.8 /100 | #61 | Exceptional 15.2% |
| Immigrants | Armenia | 99.8 /100 | #62 | Exceptional 15.2% |
| Immigrants | Sweden | 99.8 /100 | #63 | Exceptional 15.2% |
| Bangladeshis | 99.8 /100 | #64 | Exceptional 15.2% |
| Immigrants | Malaysia | 99.8 /100 | #65 | Exceptional 15.2% |
| Immigrants | Moldova | 99.8 /100 | #66 | Exceptional 15.2% |
| Paraguayans | 99.7 /100 | #67 | Exceptional 15.2% |
| Immigrants | Cameroon | 99.7 /100 | #68 | Exceptional 15.2% |
| Japanese | 99.7 /100 | #69 | Exceptional 15.2% |
| Mongolians | 99.7 /100 | #70 | Exceptional 15.3% |
| Immigrants | Brazil | 99.6 /100 | #71 | Exceptional 15.3% |
| Immigrants | Lithuania | 99.6 /100 | #72 | Exceptional 15.3% |
| Kenyans | 99.6 /100 | #73 | Exceptional 15.3% |
| Maltese | 99.6 /100 | #74 | Exceptional 15.3% |
| Immigrants | Turkey | 99.5 /100 | #75 | Exceptional 15.3% |