Assyrian/Chaldean/Syriac vs Dutch West Indian Female Poverty Among 18-24 Year Olds
COMPARE
Assyrian/Chaldean/Syriac
Dutch West Indian
Female Poverty Among 18-24 Year Olds
Female Poverty Among 18-24 Year Olds Comparison
Assyrians/Chaldeans/Syriacs
Dutch West Indians
13.7%
FEMALE POVERTY AMONG 18-24 YEAR OLDS
100.0/ 100
METRIC RATING
1st/ 347
METRIC RANK
24.5%
FEMALE POVERTY AMONG 18-24 YEAR OLDS
0.0/ 100
METRIC RATING
319th/ 347
METRIC RANK
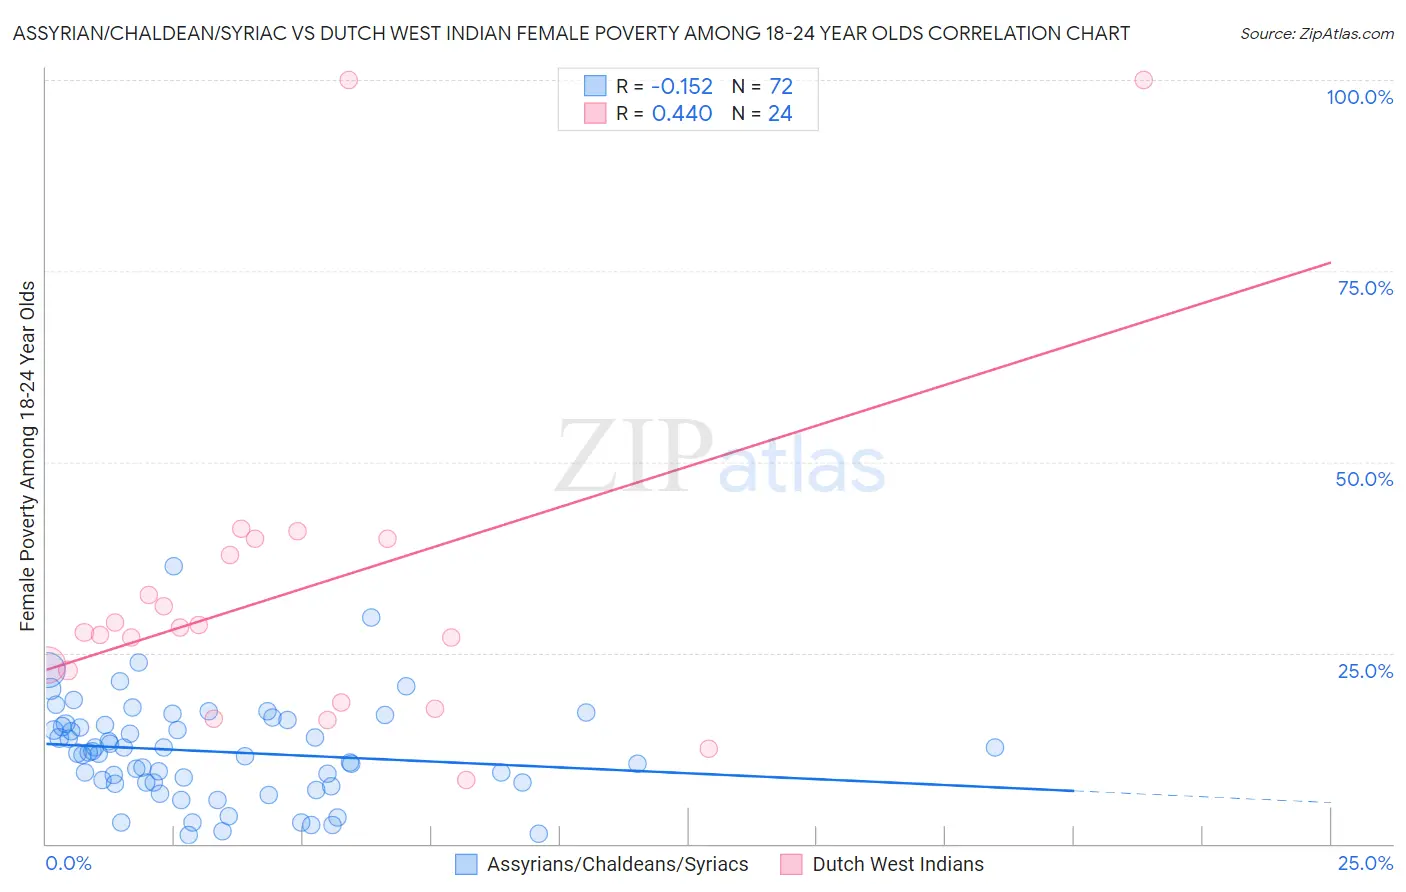
Assyrian/Chaldean/Syriac vs Dutch West Indian Female Poverty Among 18-24 Year Olds Correlation Chart
The statistical analysis conducted on geographies consisting of 109,311,768 people shows a poor negative correlation between the proportion of Assyrians/Chaldeans/Syriacs and poverty level among females between the ages 18 and 24 in the United States with a correlation coefficient (R) of -0.152 and weighted average of 13.7%. Similarly, the statistical analysis conducted on geographies consisting of 85,171,032 people shows a moderate positive correlation between the proportion of Dutch West Indians and poverty level among females between the ages 18 and 24 in the United States with a correlation coefficient (R) of 0.440 and weighted average of 24.5%, a difference of 78.7%.
Female Poverty Among 18-24 Year Olds Correlation Summary
| Measurement | Assyrian/Chaldean/Syriac | Dutch West Indian |
| Minimum | 1.2% | 8.3% |
| Maximum | 36.4% | 100.0% |
| Range | 35.2% | 91.7% |
| Mean | 12.1% | 33.1% |
| Median | 11.9% | 28.0% |
| Interquartile 25% (IQ1) | 8.0% | 20.6% |
| Interquartile 75% (IQ3) | 15.6% | 38.9% |
| Interquartile Range (IQR) | 7.6% | 18.3% |
| Standard Deviation (Sample) | 6.5% | 22.5% |
| Standard Deviation (Population) | 6.5% | 22.0% |
Similar Demographics by Female Poverty Among 18-24 Year Olds
Demographics Similar to Assyrians/Chaldeans/Syriacs by Female Poverty Among 18-24 Year Olds
In terms of female poverty among 18-24 year olds, the demographic groups most similar to Assyrians/Chaldeans/Syriacs are Chinese (16.2%, a difference of 17.9%), Immigrants from Cuba (16.4%, a difference of 19.8%), Immigrants from India (16.4%, a difference of 19.9%), Immigrants from Portugal (16.5%, a difference of 20.7%), and Immigrants from Philippines (16.7%, a difference of 21.6%).
| Demographics | Rating | Rank | Female Poverty Among 18-24 Year Olds |
| Assyrians/Chaldeans/Syriacs | 100.0 /100 | #1 | Exceptional 13.7% |
| Chinese | 100.0 /100 | #2 | Exceptional 16.2% |
| Immigrants | Cuba | 100.0 /100 | #3 | Exceptional 16.4% |
| Immigrants | India | 100.0 /100 | #4 | Exceptional 16.4% |
| Immigrants | Portugal | 100.0 /100 | #5 | Exceptional 16.5% |
| Immigrants | Philippines | 100.0 /100 | #6 | Exceptional 16.7% |
| Immigrants | Azores | 100.0 /100 | #7 | Exceptional 16.7% |
| Immigrants | Bolivia | 100.0 /100 | #8 | Exceptional 16.7% |
| Immigrants | Peru | 100.0 /100 | #9 | Exceptional 16.9% |
| Koreans | 100.0 /100 | #10 | Exceptional 16.9% |
| Thais | 100.0 /100 | #11 | Exceptional 17.0% |
| Immigrants | Pakistan | 100.0 /100 | #12 | Exceptional 17.0% |
| Immigrants | Poland | 100.0 /100 | #13 | Exceptional 17.1% |
| Tongans | 100.0 /100 | #14 | Exceptional 17.1% |
| Cubans | 100.0 /100 | #15 | Exceptional 17.2% |
Demographics Similar to Dutch West Indians by Female Poverty Among 18-24 Year Olds
In terms of female poverty among 18-24 year olds, the demographic groups most similar to Dutch West Indians are Chickasaw (24.5%, a difference of 0.10%), Osage (24.5%, a difference of 0.18%), Immigrants from Congo (24.6%, a difference of 0.30%), Alsatian (24.4%, a difference of 0.48%), and Black/African American (24.3%, a difference of 0.79%).
| Demographics | Rating | Rank | Female Poverty Among 18-24 Year Olds |
| Yuman | 0.0 /100 | #312 | Tragic 24.0% |
| Creek | 0.0 /100 | #313 | Tragic 24.2% |
| Choctaw | 0.0 /100 | #314 | Tragic 24.3% |
| Blacks/African Americans | 0.0 /100 | #315 | Tragic 24.3% |
| Alsatians | 0.0 /100 | #316 | Tragic 24.4% |
| Osage | 0.0 /100 | #317 | Tragic 24.5% |
| Chickasaw | 0.0 /100 | #318 | Tragic 24.5% |
| Dutch West Indians | 0.0 /100 | #319 | Tragic 24.5% |
| Immigrants | Congo | 0.0 /100 | #320 | Tragic 24.6% |
| Immigrants | Zaire | 0.0 /100 | #321 | Tragic 25.1% |
| Somalis | 0.0 /100 | #322 | Tragic 25.1% |
| Arapaho | 0.0 /100 | #323 | Tragic 25.2% |
| German Russians | 0.0 /100 | #324 | Tragic 25.2% |
| Immigrants | Saudi Arabia | 0.0 /100 | #325 | Tragic 25.3% |
| Yakama | 0.0 /100 | #326 | Tragic 25.3% |