Assyrian/Chaldean/Syriac vs Spanish American Female Poverty Among 18-24 Year Olds
COMPARE
Assyrian/Chaldean/Syriac
Spanish American
Female Poverty Among 18-24 Year Olds
Female Poverty Among 18-24 Year Olds Comparison
Assyrians/Chaldeans/Syriacs
Spanish Americans
13.7%
FEMALE POVERTY AMONG 18-24 YEAR OLDS
100.0/ 100
METRIC RATING
1st/ 347
METRIC RANK
21.9%
FEMALE POVERTY AMONG 18-24 YEAR OLDS
0.1/ 100
METRIC RATING
279th/ 347
METRIC RANK
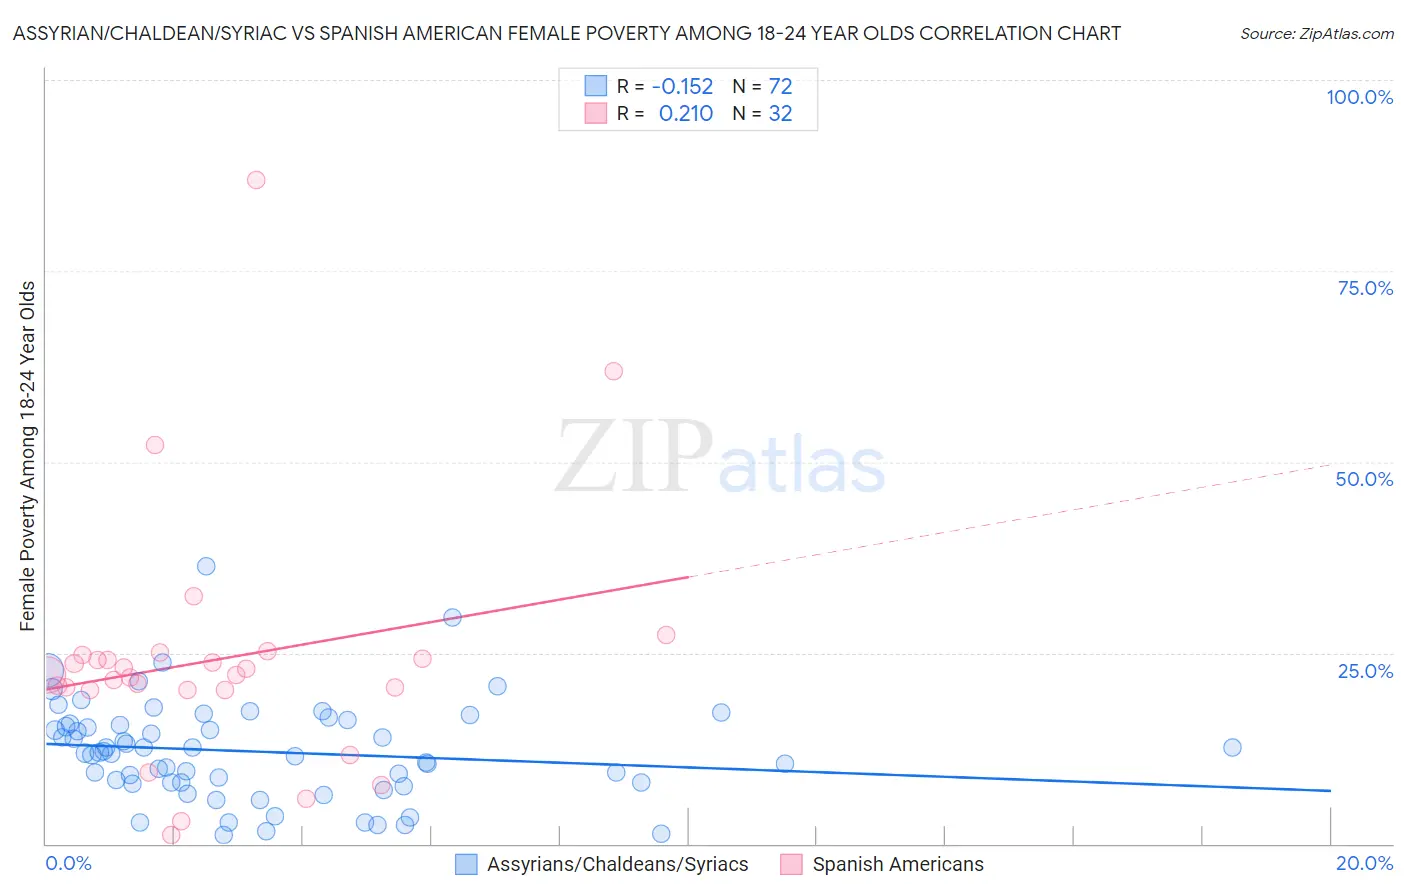
Assyrian/Chaldean/Syriac vs Spanish American Female Poverty Among 18-24 Year Olds Correlation Chart
The statistical analysis conducted on geographies consisting of 109,311,768 people shows a poor negative correlation between the proportion of Assyrians/Chaldeans/Syriacs and poverty level among females between the ages 18 and 24 in the United States with a correlation coefficient (R) of -0.152 and weighted average of 13.7%. Similarly, the statistical analysis conducted on geographies consisting of 102,596,848 people shows a weak positive correlation between the proportion of Spanish Americans and poverty level among females between the ages 18 and 24 in the United States with a correlation coefficient (R) of 0.210 and weighted average of 21.9%, a difference of 59.9%.
Female Poverty Among 18-24 Year Olds Correlation Summary
| Measurement | Assyrian/Chaldean/Syriac | Spanish American |
| Minimum | 1.2% | 1.1% |
| Maximum | 36.4% | 87.0% |
| Range | 35.2% | 85.8% |
| Mean | 12.1% | 24.1% |
| Median | 11.9% | 22.1% |
| Interquartile 25% (IQ1) | 8.0% | 20.2% |
| Interquartile 75% (IQ3) | 15.6% | 24.5% |
| Interquartile Range (IQR) | 7.6% | 4.3% |
| Standard Deviation (Sample) | 6.5% | 16.4% |
| Standard Deviation (Population) | 6.5% | 16.1% |
Similar Demographics by Female Poverty Among 18-24 Year Olds
Demographics Similar to Assyrians/Chaldeans/Syriacs by Female Poverty Among 18-24 Year Olds
In terms of female poverty among 18-24 year olds, the demographic groups most similar to Assyrians/Chaldeans/Syriacs are Chinese (16.2%, a difference of 17.9%), Immigrants from Cuba (16.4%, a difference of 19.8%), Immigrants from India (16.4%, a difference of 19.9%), Immigrants from Portugal (16.5%, a difference of 20.7%), and Immigrants from Philippines (16.7%, a difference of 21.6%).
| Demographics | Rating | Rank | Female Poverty Among 18-24 Year Olds |
| Assyrians/Chaldeans/Syriacs | 100.0 /100 | #1 | Exceptional 13.7% |
| Chinese | 100.0 /100 | #2 | Exceptional 16.2% |
| Immigrants | Cuba | 100.0 /100 | #3 | Exceptional 16.4% |
| Immigrants | India | 100.0 /100 | #4 | Exceptional 16.4% |
| Immigrants | Portugal | 100.0 /100 | #5 | Exceptional 16.5% |
| Immigrants | Philippines | 100.0 /100 | #6 | Exceptional 16.7% |
| Immigrants | Azores | 100.0 /100 | #7 | Exceptional 16.7% |
| Immigrants | Bolivia | 100.0 /100 | #8 | Exceptional 16.7% |
| Immigrants | Peru | 100.0 /100 | #9 | Exceptional 16.9% |
| Koreans | 100.0 /100 | #10 | Exceptional 16.9% |
| Thais | 100.0 /100 | #11 | Exceptional 17.0% |
| Immigrants | Pakistan | 100.0 /100 | #12 | Exceptional 17.0% |
| Immigrants | Poland | 100.0 /100 | #13 | Exceptional 17.1% |
| Tongans | 100.0 /100 | #14 | Exceptional 17.1% |
| Cubans | 100.0 /100 | #15 | Exceptional 17.2% |
Demographics Similar to Spanish Americans by Female Poverty Among 18-24 Year Olds
In terms of female poverty among 18-24 year olds, the demographic groups most similar to Spanish Americans are Immigrants from Dominica (21.9%, a difference of 0.010%), Immigrants from Dominican Republic (21.9%, a difference of 0.050%), Bermudan (21.9%, a difference of 0.14%), Yaqui (21.9%, a difference of 0.17%), and Immigrants from Switzerland (21.8%, a difference of 0.43%).
| Demographics | Rating | Rank | Female Poverty Among 18-24 Year Olds |
| Basques | 0.2 /100 | #272 | Tragic 21.7% |
| New Zealanders | 0.2 /100 | #273 | Tragic 21.7% |
| Immigrants | Honduras | 0.1 /100 | #274 | Tragic 21.8% |
| Immigrants | Bangladesh | 0.1 /100 | #275 | Tragic 21.8% |
| Bahamians | 0.1 /100 | #276 | Tragic 21.8% |
| Immigrants | Switzerland | 0.1 /100 | #277 | Tragic 21.8% |
| Yaqui | 0.1 /100 | #278 | Tragic 21.9% |
| Spanish Americans | 0.1 /100 | #279 | Tragic 21.9% |
| Immigrants | Dominica | 0.1 /100 | #280 | Tragic 21.9% |
| Immigrants | Dominican Republic | 0.1 /100 | #281 | Tragic 21.9% |
| Bermudans | 0.1 /100 | #282 | Tragic 21.9% |
| Sub-Saharan Africans | 0.0 /100 | #283 | Tragic 22.0% |
| Tlingit-Haida | 0.0 /100 | #284 | Tragic 22.0% |
| Ottawa | 0.0 /100 | #285 | Tragic 22.0% |
| Ugandans | 0.0 /100 | #286 | Tragic 22.1% |