Immigrants from Eritrea vs Dutch West Indian Female Poverty Among 18-24 Year Olds
COMPARE
Immigrants from Eritrea
Dutch West Indian
Female Poverty Among 18-24 Year Olds
Female Poverty Among 18-24 Year Olds Comparison
Immigrants from Eritrea
Dutch West Indians
20.9%
FEMALE POVERTY AMONG 18-24 YEAR OLDS
4.2/ 100
METRIC RATING
241st/ 347
METRIC RANK
24.5%
FEMALE POVERTY AMONG 18-24 YEAR OLDS
0.0/ 100
METRIC RATING
319th/ 347
METRIC RANK
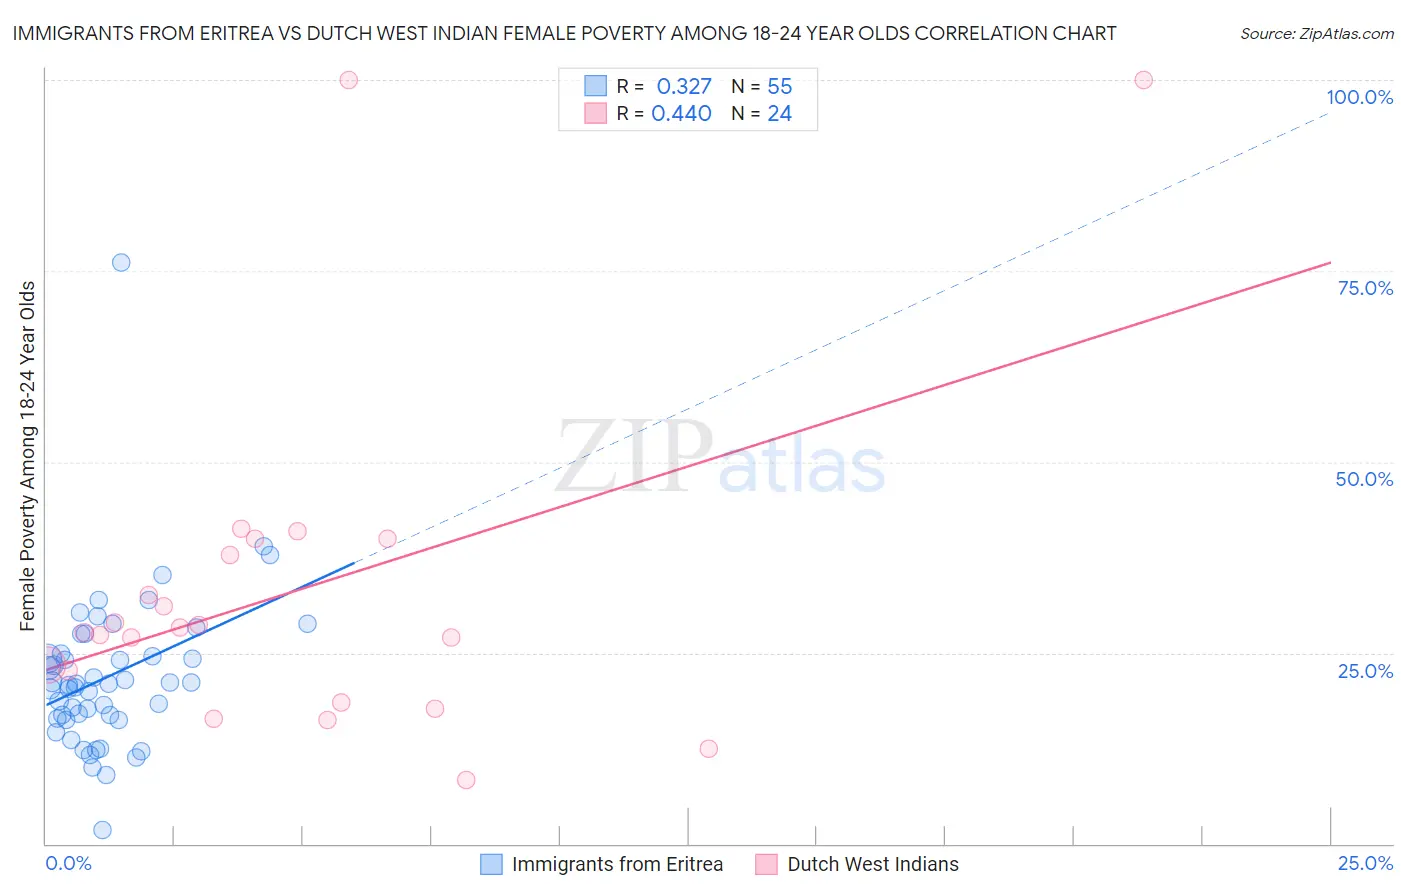
Immigrants from Eritrea vs Dutch West Indian Female Poverty Among 18-24 Year Olds Correlation Chart
The statistical analysis conducted on geographies consisting of 104,465,492 people shows a mild positive correlation between the proportion of Immigrants from Eritrea and poverty level among females between the ages 18 and 24 in the United States with a correlation coefficient (R) of 0.327 and weighted average of 20.9%. Similarly, the statistical analysis conducted on geographies consisting of 85,171,032 people shows a moderate positive correlation between the proportion of Dutch West Indians and poverty level among females between the ages 18 and 24 in the United States with a correlation coefficient (R) of 0.440 and weighted average of 24.5%, a difference of 17.4%.
Female Poverty Among 18-24 Year Olds Correlation Summary
| Measurement | Immigrants from Eritrea | Dutch West Indian |
| Minimum | 1.8% | 8.3% |
| Maximum | 76.0% | 100.0% |
| Range | 74.2% | 91.7% |
| Mean | 21.9% | 33.1% |
| Median | 21.0% | 28.0% |
| Interquartile 25% (IQ1) | 16.4% | 20.6% |
| Interquartile 75% (IQ3) | 24.9% | 38.9% |
| Interquartile Range (IQR) | 8.5% | 18.3% |
| Standard Deviation (Sample) | 10.5% | 22.5% |
| Standard Deviation (Population) | 10.4% | 22.0% |
Similar Demographics by Female Poverty Among 18-24 Year Olds
Demographics Similar to Immigrants from Eritrea by Female Poverty Among 18-24 Year Olds
In terms of female poverty among 18-24 year olds, the demographic groups most similar to Immigrants from Eritrea are Israeli (20.9%, a difference of 0.010%), Luxembourger (20.9%, a difference of 0.020%), Immigrants from Guatemala (20.9%, a difference of 0.040%), Immigrants from Singapore (20.9%, a difference of 0.050%), and Scottish (20.9%, a difference of 0.090%).
| Demographics | Rating | Rank | Female Poverty Among 18-24 Year Olds |
| Welsh | 5.4 /100 | #234 | Tragic 20.8% |
| Immigrants | Uganda | 5.1 /100 | #235 | Tragic 20.8% |
| Okinawans | 4.9 /100 | #236 | Tragic 20.8% |
| Scottish | 4.5 /100 | #237 | Tragic 20.9% |
| Immigrants | Singapore | 4.4 /100 | #238 | Tragic 20.9% |
| Immigrants | Guatemala | 4.3 /100 | #239 | Tragic 20.9% |
| Luxembourgers | 4.2 /100 | #240 | Tragic 20.9% |
| Immigrants | Eritrea | 4.2 /100 | #241 | Tragic 20.9% |
| Israelis | 4.1 /100 | #242 | Tragic 20.9% |
| Marshallese | 3.4 /100 | #243 | Tragic 20.9% |
| Immigrants | Thailand | 3.4 /100 | #244 | Tragic 20.9% |
| Aleuts | 3.3 /100 | #245 | Tragic 20.9% |
| Immigrants | Australia | 3.1 /100 | #246 | Tragic 20.9% |
| Immigrants | Africa | 3.0 /100 | #247 | Tragic 21.0% |
| Immigrants | Kenya | 2.5 /100 | #248 | Tragic 21.0% |
Demographics Similar to Dutch West Indians by Female Poverty Among 18-24 Year Olds
In terms of female poverty among 18-24 year olds, the demographic groups most similar to Dutch West Indians are Chickasaw (24.5%, a difference of 0.10%), Osage (24.5%, a difference of 0.18%), Immigrants from Congo (24.6%, a difference of 0.30%), Alsatian (24.4%, a difference of 0.48%), and Black/African American (24.3%, a difference of 0.79%).
| Demographics | Rating | Rank | Female Poverty Among 18-24 Year Olds |
| Yuman | 0.0 /100 | #312 | Tragic 24.0% |
| Creek | 0.0 /100 | #313 | Tragic 24.2% |
| Choctaw | 0.0 /100 | #314 | Tragic 24.3% |
| Blacks/African Americans | 0.0 /100 | #315 | Tragic 24.3% |
| Alsatians | 0.0 /100 | #316 | Tragic 24.4% |
| Osage | 0.0 /100 | #317 | Tragic 24.5% |
| Chickasaw | 0.0 /100 | #318 | Tragic 24.5% |
| Dutch West Indians | 0.0 /100 | #319 | Tragic 24.5% |
| Immigrants | Congo | 0.0 /100 | #320 | Tragic 24.6% |
| Immigrants | Zaire | 0.0 /100 | #321 | Tragic 25.1% |
| Somalis | 0.0 /100 | #322 | Tragic 25.1% |
| Arapaho | 0.0 /100 | #323 | Tragic 25.2% |
| German Russians | 0.0 /100 | #324 | Tragic 25.2% |
| Immigrants | Saudi Arabia | 0.0 /100 | #325 | Tragic 25.3% |
| Yakama | 0.0 /100 | #326 | Tragic 25.3% |