Assyrian/Chaldean/Syriac vs Alaskan Athabascan Female Poverty Among 18-24 Year Olds
COMPARE
Assyrian/Chaldean/Syriac
Alaskan Athabascan
Female Poverty Among 18-24 Year Olds
Female Poverty Among 18-24 Year Olds Comparison
Assyrians/Chaldeans/Syriacs
Alaskan Athabascans
13.7%
FEMALE POVERTY AMONG 18-24 YEAR OLDS
100.0/ 100
METRIC RATING
1st/ 347
METRIC RANK
22.5%
FEMALE POVERTY AMONG 18-24 YEAR OLDS
0.0/ 100
METRIC RATING
292nd/ 347
METRIC RANK
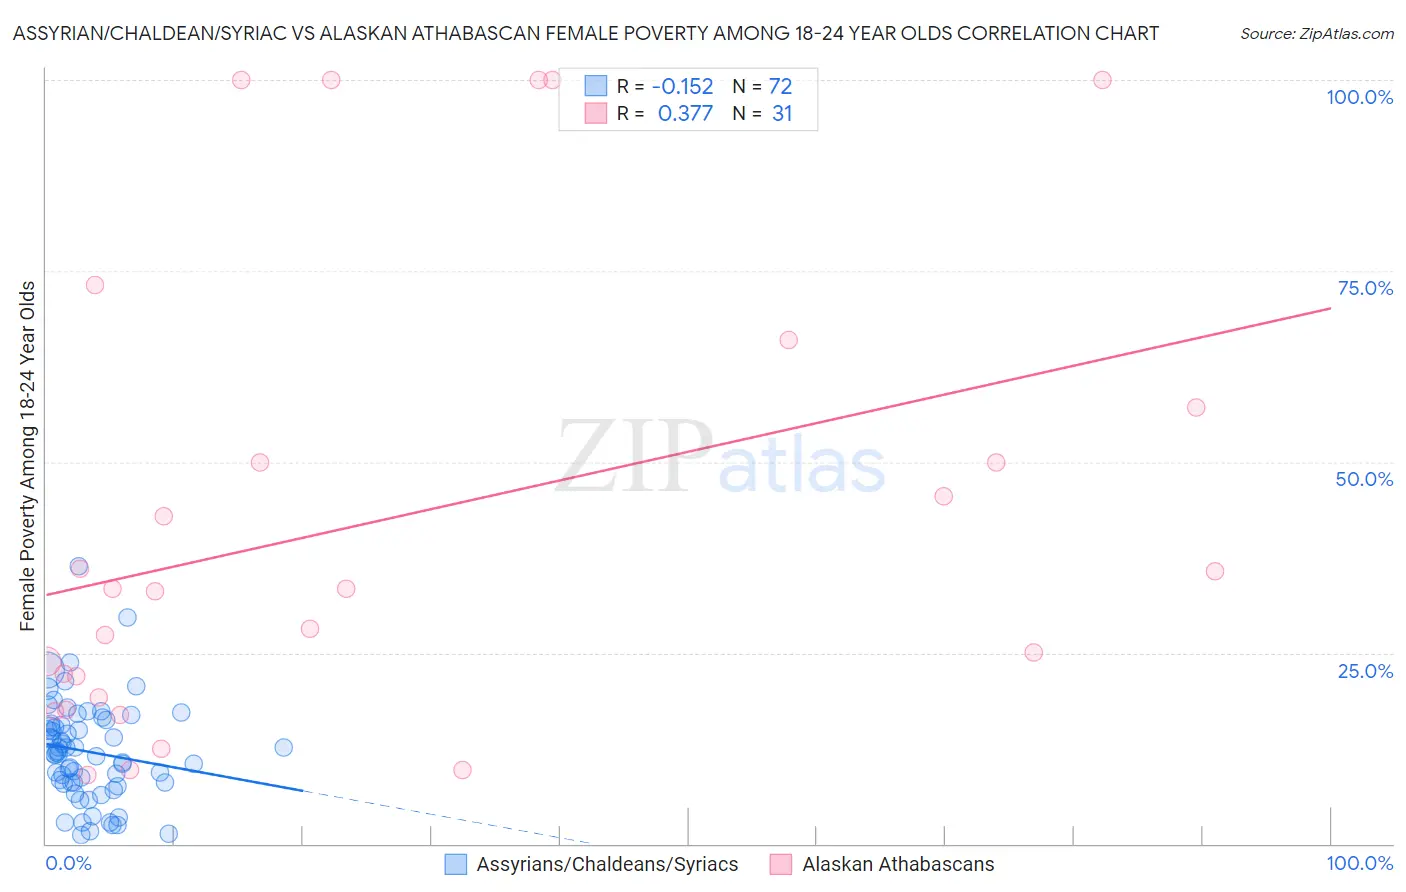
Assyrian/Chaldean/Syriac vs Alaskan Athabascan Female Poverty Among 18-24 Year Olds Correlation Chart
The statistical analysis conducted on geographies consisting of 109,311,768 people shows a poor negative correlation between the proportion of Assyrians/Chaldeans/Syriacs and poverty level among females between the ages 18 and 24 in the United States with a correlation coefficient (R) of -0.152 and weighted average of 13.7%. Similarly, the statistical analysis conducted on geographies consisting of 45,408,377 people shows a mild positive correlation between the proportion of Alaskan Athabascans and poverty level among females between the ages 18 and 24 in the United States with a correlation coefficient (R) of 0.377 and weighted average of 22.5%, a difference of 63.9%.
Female Poverty Among 18-24 Year Olds Correlation Summary
| Measurement | Assyrian/Chaldean/Syriac | Alaskan Athabascan |
| Minimum | 1.2% | 9.0% |
| Maximum | 36.4% | 100.0% |
| Range | 35.2% | 91.0% |
| Mean | 12.1% | 42.5% |
| Median | 11.9% | 33.3% |
| Interquartile 25% (IQ1) | 8.0% | 19.2% |
| Interquartile 75% (IQ3) | 15.6% | 57.1% |
| Interquartile Range (IQR) | 7.6% | 37.9% |
| Standard Deviation (Sample) | 6.5% | 30.1% |
| Standard Deviation (Population) | 6.5% | 29.7% |
Similar Demographics by Female Poverty Among 18-24 Year Olds
Demographics Similar to Assyrians/Chaldeans/Syriacs by Female Poverty Among 18-24 Year Olds
In terms of female poverty among 18-24 year olds, the demographic groups most similar to Assyrians/Chaldeans/Syriacs are Chinese (16.2%, a difference of 17.9%), Immigrants from Cuba (16.4%, a difference of 19.8%), Immigrants from India (16.4%, a difference of 19.9%), Immigrants from Portugal (16.5%, a difference of 20.7%), and Immigrants from Philippines (16.7%, a difference of 21.6%).
| Demographics | Rating | Rank | Female Poverty Among 18-24 Year Olds |
| Assyrians/Chaldeans/Syriacs | 100.0 /100 | #1 | Exceptional 13.7% |
| Chinese | 100.0 /100 | #2 | Exceptional 16.2% |
| Immigrants | Cuba | 100.0 /100 | #3 | Exceptional 16.4% |
| Immigrants | India | 100.0 /100 | #4 | Exceptional 16.4% |
| Immigrants | Portugal | 100.0 /100 | #5 | Exceptional 16.5% |
| Immigrants | Philippines | 100.0 /100 | #6 | Exceptional 16.7% |
| Immigrants | Azores | 100.0 /100 | #7 | Exceptional 16.7% |
| Immigrants | Bolivia | 100.0 /100 | #8 | Exceptional 16.7% |
| Immigrants | Peru | 100.0 /100 | #9 | Exceptional 16.9% |
| Koreans | 100.0 /100 | #10 | Exceptional 16.9% |
| Thais | 100.0 /100 | #11 | Exceptional 17.0% |
| Immigrants | Pakistan | 100.0 /100 | #12 | Exceptional 17.0% |
| Immigrants | Poland | 100.0 /100 | #13 | Exceptional 17.1% |
| Tongans | 100.0 /100 | #14 | Exceptional 17.1% |
| Cubans | 100.0 /100 | #15 | Exceptional 17.2% |
Demographics Similar to Alaskan Athabascans by Female Poverty Among 18-24 Year Olds
In terms of female poverty among 18-24 year olds, the demographic groups most similar to Alaskan Athabascans are U.S. Virgin Islander (22.5%, a difference of 0.030%), Bangladeshi (22.5%, a difference of 0.050%), Indonesian (22.5%, a difference of 0.070%), Shoshone (22.5%, a difference of 0.19%), and Menominee (22.5%, a difference of 0.30%).
| Demographics | Rating | Rank | Female Poverty Among 18-24 Year Olds |
| Ottawa | 0.0 /100 | #285 | Tragic 22.0% |
| Ugandans | 0.0 /100 | #286 | Tragic 22.1% |
| Immigrants | Middle Africa | 0.0 /100 | #287 | Tragic 22.1% |
| Dominicans | 0.0 /100 | #288 | Tragic 22.3% |
| French American Indians | 0.0 /100 | #289 | Tragic 22.3% |
| Immigrants | Senegal | 0.0 /100 | #290 | Tragic 22.4% |
| Bangladeshis | 0.0 /100 | #291 | Tragic 22.5% |
| Alaskan Athabascans | 0.0 /100 | #292 | Tragic 22.5% |
| U.S. Virgin Islanders | 0.0 /100 | #293 | Tragic 22.5% |
| Indonesians | 0.0 /100 | #294 | Tragic 22.5% |
| Shoshone | 0.0 /100 | #295 | Tragic 22.5% |
| Menominee | 0.0 /100 | #296 | Tragic 22.5% |
| Inupiat | 0.0 /100 | #297 | Tragic 22.6% |
| Central American Indians | 0.0 /100 | #298 | Tragic 22.6% |
| Cherokee | 0.0 /100 | #299 | Tragic 22.7% |