Assyrian/Chaldean/Syriac vs Dutch West Indian Professional Degree
COMPARE
Assyrian/Chaldean/Syriac
Dutch West Indian
Professional Degree
Professional Degree Comparison
Assyrians/Chaldeans/Syriacs
Dutch West Indians
4.5%
PROFESSIONAL DEGREE
67.4/ 100
METRIC RATING
161st/ 347
METRIC RANK
3.1%
PROFESSIONAL DEGREE
0.0/ 100
METRIC RATING
327th/ 347
METRIC RANK
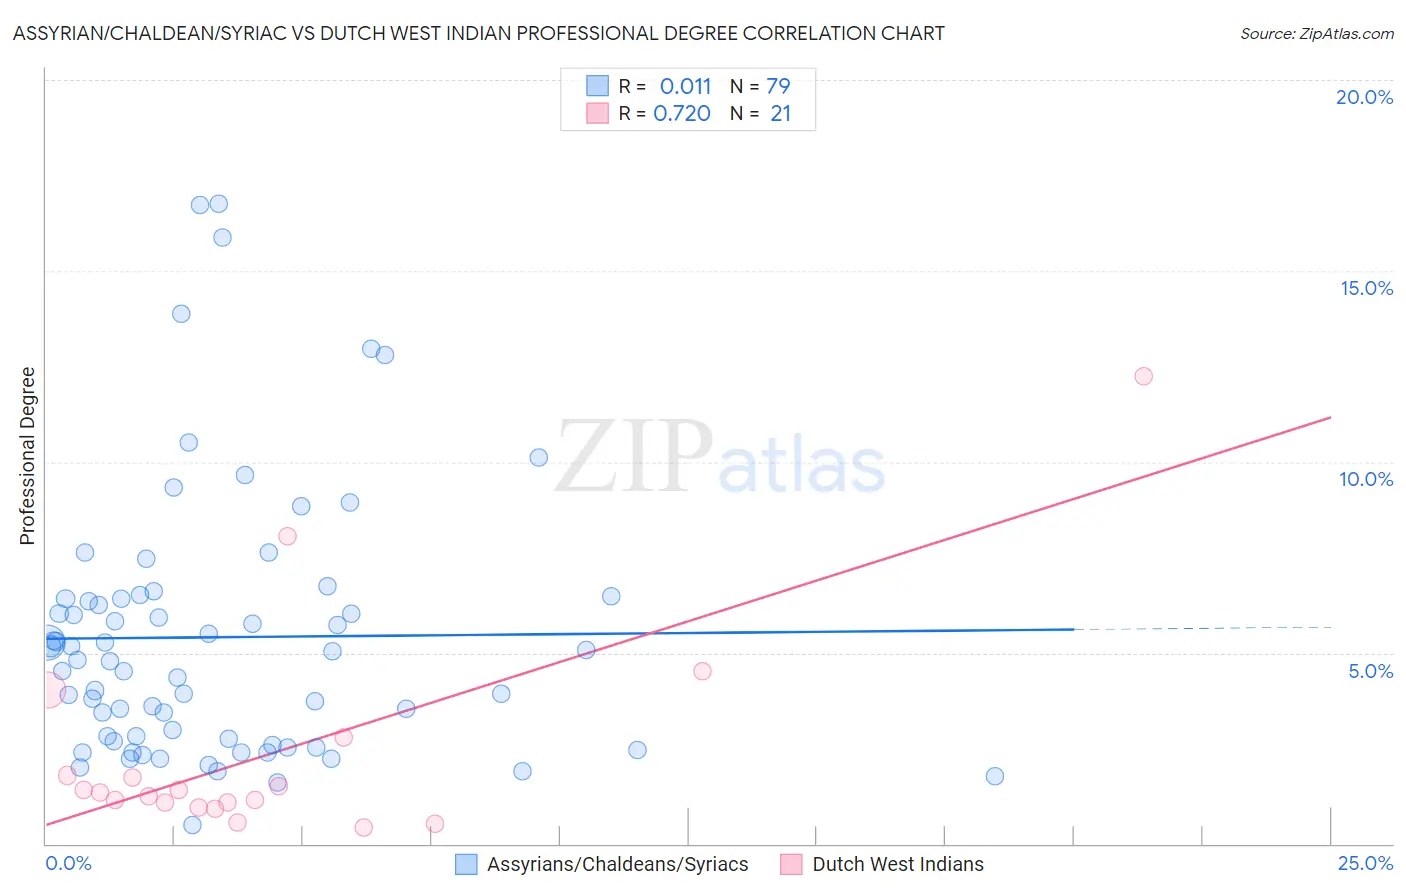
Assyrian/Chaldean/Syriac vs Dutch West Indian Professional Degree Correlation Chart
The statistical analysis conducted on geographies consisting of 110,257,052 people shows no correlation between the proportion of Assyrians/Chaldeans/Syriacs and percentage of population with at least professional degree education in the United States with a correlation coefficient (R) of 0.011 and weighted average of 4.5%. Similarly, the statistical analysis conducted on geographies consisting of 85,349,686 people shows a strong positive correlation between the proportion of Dutch West Indians and percentage of population with at least professional degree education in the United States with a correlation coefficient (R) of 0.720 and weighted average of 3.1%, a difference of 46.0%.
Professional Degree Correlation Summary
| Measurement | Assyrian/Chaldean/Syriac | Dutch West Indian |
| Minimum | 0.50% | 0.42% |
| Maximum | 16.8% | 12.2% |
| Range | 16.3% | 11.8% |
| Mean | 5.4% | 2.4% |
| Median | 4.8% | 1.4% |
| Interquartile 25% (IQ1) | 2.7% | 1.0% |
| Interquartile 75% (IQ3) | 6.4% | 2.3% |
| Interquartile Range (IQR) | 3.7% | 1.3% |
| Standard Deviation (Sample) | 3.5% | 2.9% |
| Standard Deviation (Population) | 3.5% | 2.8% |
Similar Demographics by Professional Degree
Demographics Similar to Assyrians/Chaldeans/Syriacs by Professional Degree
In terms of professional degree, the demographic groups most similar to Assyrians/Chaldeans/Syriacs are Immigrants from Senegal (4.5%, a difference of 0.10%), Vietnamese (4.5%, a difference of 0.16%), Immigrants from Armenia (4.5%, a difference of 0.24%), Peruvian (4.5%, a difference of 0.34%), and Iraqi (4.5%, a difference of 0.41%).
| Demographics | Rating | Rank | Professional Degree |
| Scottish | 71.8 /100 | #154 | Good 4.6% |
| Slavs | 70.8 /100 | #155 | Good 4.5% |
| Swedes | 69.9 /100 | #156 | Good 4.5% |
| Iraqis | 69.8 /100 | #157 | Good 4.5% |
| Immigrants | Armenia | 68.8 /100 | #158 | Good 4.5% |
| Vietnamese | 68.4 /100 | #159 | Good 4.5% |
| Immigrants | Senegal | 68.0 /100 | #160 | Good 4.5% |
| Assyrians/Chaldeans/Syriacs | 67.4 /100 | #161 | Good 4.5% |
| Peruvians | 65.2 /100 | #162 | Good 4.5% |
| Sierra Leoneans | 64.3 /100 | #163 | Good 4.5% |
| Swiss | 61.0 /100 | #164 | Good 4.5% |
| Costa Ricans | 59.9 /100 | #165 | Average 4.5% |
| Immigrants | Colombia | 59.4 /100 | #166 | Average 4.5% |
| Immigrants | Afghanistan | 59.2 /100 | #167 | Average 4.5% |
| Immigrants | Sierra Leone | 58.7 /100 | #168 | Average 4.5% |
Demographics Similar to Dutch West Indians by Professional Degree
In terms of professional degree, the demographic groups most similar to Dutch West Indians are Creek (3.1%, a difference of 0.060%), Menominee (3.1%, a difference of 0.10%), Bangladeshi (3.1%, a difference of 0.27%), Immigrants from Cabo Verde (3.1%, a difference of 0.35%), and Kiowa (3.1%, a difference of 0.47%).
| Demographics | Rating | Rank | Professional Degree |
| Seminole | 0.1 /100 | #320 | Tragic 3.2% |
| Tsimshian | 0.0 /100 | #321 | Tragic 3.2% |
| Hispanics or Latinos | 0.0 /100 | #322 | Tragic 3.2% |
| Inupiat | 0.0 /100 | #323 | Tragic 3.2% |
| Crow | 0.0 /100 | #324 | Tragic 3.2% |
| Yaqui | 0.0 /100 | #325 | Tragic 3.2% |
| Menominee | 0.0 /100 | #326 | Tragic 3.1% |
| Dutch West Indians | 0.0 /100 | #327 | Tragic 3.1% |
| Creek | 0.0 /100 | #328 | Tragic 3.1% |
| Bangladeshis | 0.0 /100 | #329 | Tragic 3.1% |
| Immigrants | Cabo Verde | 0.0 /100 | #330 | Tragic 3.1% |
| Kiowa | 0.0 /100 | #331 | Tragic 3.1% |
| Yakama | 0.0 /100 | #332 | Tragic 3.1% |
| Puget Sound Salish | 0.0 /100 | #333 | Tragic 3.1% |
| Pennsylvania Germans | 0.0 /100 | #334 | Tragic 3.0% |