Sioux vs Dutch West Indian Female Poverty Among 18-24 Year Olds
COMPARE
Sioux
Dutch West Indian
Female Poverty Among 18-24 Year Olds
Female Poverty Among 18-24 Year Olds Comparison
Sioux
Dutch West Indians
28.6%
FEMALE POVERTY AMONG 18-24 YEAR OLDS
0.0/ 100
METRIC RATING
340th/ 347
METRIC RANK
24.5%
FEMALE POVERTY AMONG 18-24 YEAR OLDS
0.0/ 100
METRIC RATING
319th/ 347
METRIC RANK
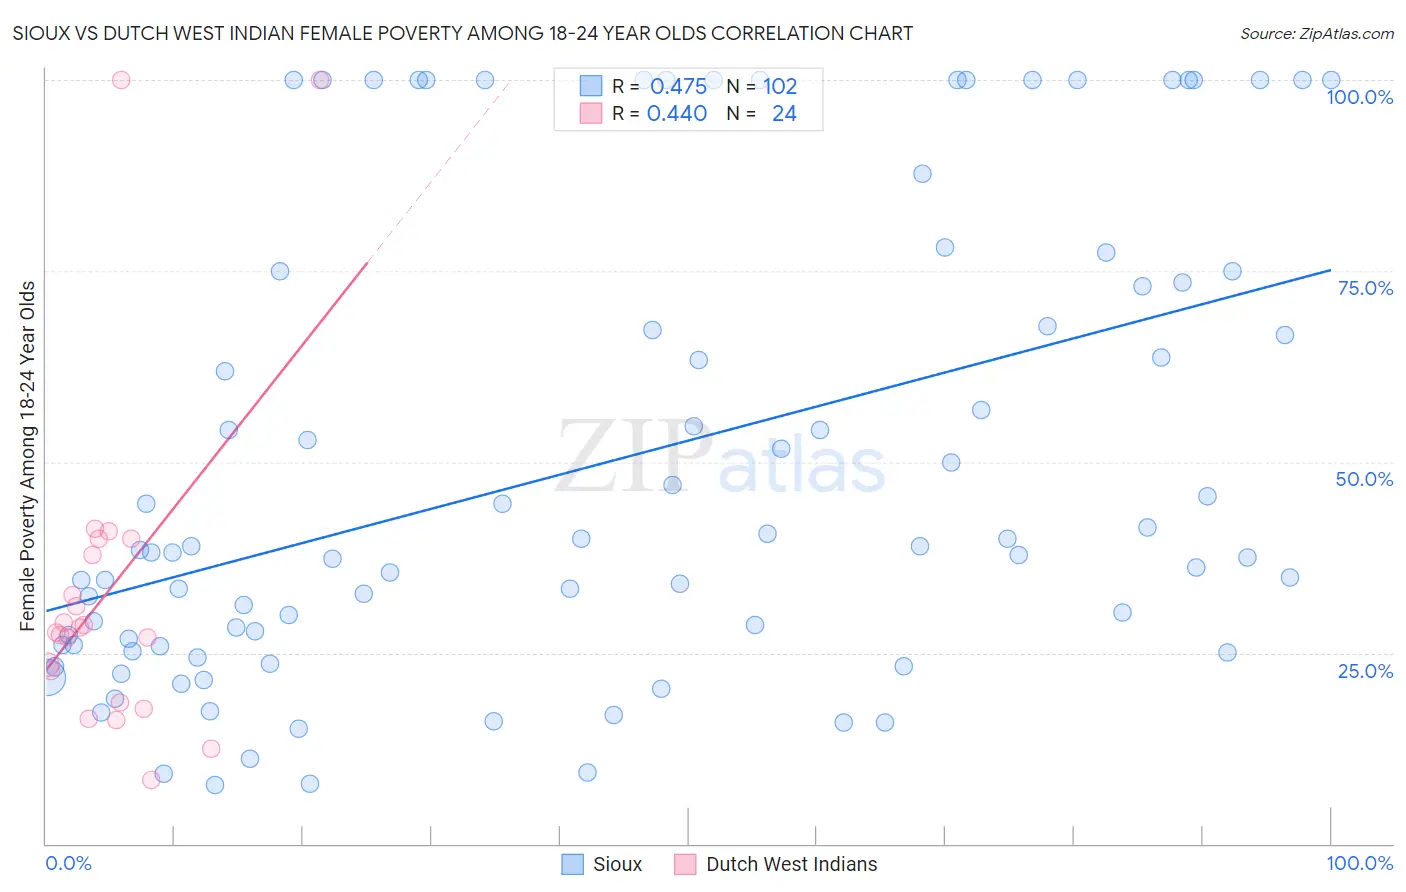
Sioux vs Dutch West Indian Female Poverty Among 18-24 Year Olds Correlation Chart
The statistical analysis conducted on geographies consisting of 230,923,136 people shows a moderate positive correlation between the proportion of Sioux and poverty level among females between the ages 18 and 24 in the United States with a correlation coefficient (R) of 0.475 and weighted average of 28.6%. Similarly, the statistical analysis conducted on geographies consisting of 85,171,032 people shows a moderate positive correlation between the proportion of Dutch West Indians and poverty level among females between the ages 18 and 24 in the United States with a correlation coefficient (R) of 0.440 and weighted average of 24.5%, a difference of 16.6%.
Female Poverty Among 18-24 Year Olds Correlation Summary
| Measurement | Sioux | Dutch West Indian |
| Minimum | 7.7% | 8.3% |
| Maximum | 100.0% | 100.0% |
| Range | 92.3% | 91.7% |
| Mean | 49.6% | 33.1% |
| Median | 38.3% | 28.0% |
| Interquartile 25% (IQ1) | 26.1% | 20.6% |
| Interquartile 75% (IQ3) | 73.5% | 38.9% |
| Interquartile Range (IQR) | 47.4% | 18.3% |
| Standard Deviation (Sample) | 30.2% | 22.5% |
| Standard Deviation (Population) | 30.0% | 22.0% |
Similar Demographics by Female Poverty Among 18-24 Year Olds
Demographics Similar to Sioux by Female Poverty Among 18-24 Year Olds
In terms of female poverty among 18-24 year olds, the demographic groups most similar to Sioux are Pima (28.4%, a difference of 0.55%), Hopi (28.2%, a difference of 1.3%), Cheyenne (28.1%, a difference of 1.5%), Colville (29.0%, a difference of 1.6%), and Kiowa (29.2%, a difference of 2.3%).
| Demographics | Rating | Rank | Female Poverty Among 18-24 Year Olds |
| Apache | 0.0 /100 | #333 | Tragic 26.3% |
| Pueblo | 0.0 /100 | #334 | Tragic 26.9% |
| Yup'ik | 0.0 /100 | #335 | Tragic 27.0% |
| Immigrants | Yemen | 0.0 /100 | #336 | Tragic 27.5% |
| Cheyenne | 0.0 /100 | #337 | Tragic 28.1% |
| Hopi | 0.0 /100 | #338 | Tragic 28.2% |
| Pima | 0.0 /100 | #339 | Tragic 28.4% |
| Sioux | 0.0 /100 | #340 | Tragic 28.6% |
| Colville | 0.0 /100 | #341 | Tragic 29.0% |
| Kiowa | 0.0 /100 | #342 | Tragic 29.2% |
| Puerto Ricans | 0.0 /100 | #343 | Tragic 29.8% |
| Navajo | 0.0 /100 | #344 | Tragic 30.3% |
| Tohono O'odham | 0.0 /100 | #345 | Tragic 31.0% |
| Lumbee | 0.0 /100 | #346 | Tragic 31.1% |
| Crow | 0.0 /100 | #347 | Tragic 33.2% |
Demographics Similar to Dutch West Indians by Female Poverty Among 18-24 Year Olds
In terms of female poverty among 18-24 year olds, the demographic groups most similar to Dutch West Indians are Chickasaw (24.5%, a difference of 0.10%), Osage (24.5%, a difference of 0.18%), Immigrants from Congo (24.6%, a difference of 0.30%), Alsatian (24.4%, a difference of 0.48%), and Black/African American (24.3%, a difference of 0.79%).
| Demographics | Rating | Rank | Female Poverty Among 18-24 Year Olds |
| Yuman | 0.0 /100 | #312 | Tragic 24.0% |
| Creek | 0.0 /100 | #313 | Tragic 24.2% |
| Choctaw | 0.0 /100 | #314 | Tragic 24.3% |
| Blacks/African Americans | 0.0 /100 | #315 | Tragic 24.3% |
| Alsatians | 0.0 /100 | #316 | Tragic 24.4% |
| Osage | 0.0 /100 | #317 | Tragic 24.5% |
| Chickasaw | 0.0 /100 | #318 | Tragic 24.5% |
| Dutch West Indians | 0.0 /100 | #319 | Tragic 24.5% |
| Immigrants | Congo | 0.0 /100 | #320 | Tragic 24.6% |
| Immigrants | Zaire | 0.0 /100 | #321 | Tragic 25.1% |
| Somalis | 0.0 /100 | #322 | Tragic 25.1% |
| Arapaho | 0.0 /100 | #323 | Tragic 25.2% |
| German Russians | 0.0 /100 | #324 | Tragic 25.2% |
| Immigrants | Saudi Arabia | 0.0 /100 | #325 | Tragic 25.3% |
| Yakama | 0.0 /100 | #326 | Tragic 25.3% |