Immigrants from Liberia vs Dutch West Indian Female Poverty Among 18-24 Year Olds
COMPARE
Immigrants from Liberia
Dutch West Indian
Female Poverty Among 18-24 Year Olds
Female Poverty Among 18-24 Year Olds Comparison
Immigrants from Liberia
Dutch West Indians
20.7%
FEMALE POVERTY AMONG 18-24 YEAR OLDS
7.6/ 100
METRIC RATING
224th/ 347
METRIC RANK
24.5%
FEMALE POVERTY AMONG 18-24 YEAR OLDS
0.0/ 100
METRIC RATING
319th/ 347
METRIC RANK
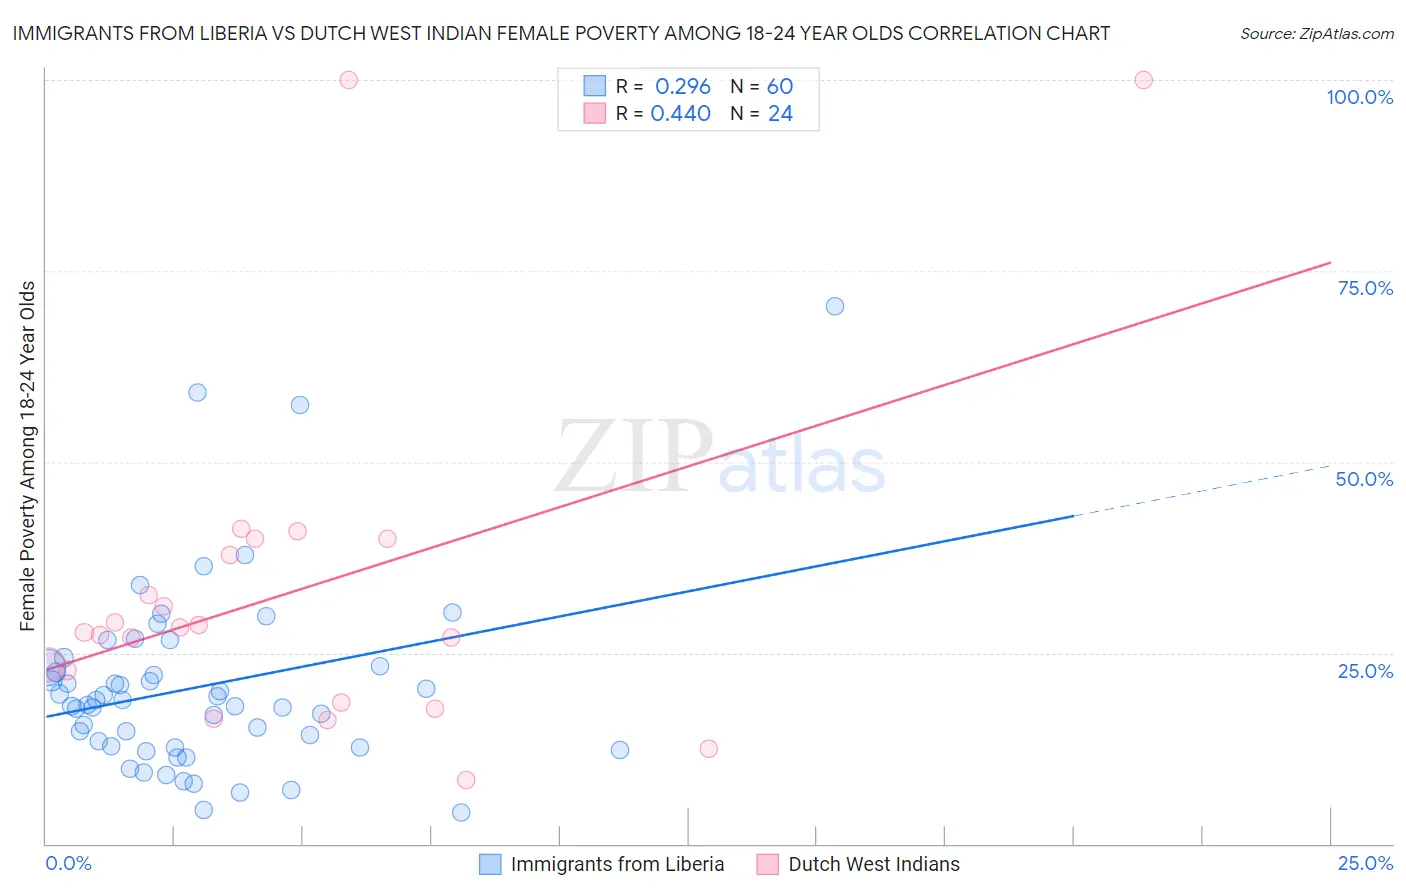
Immigrants from Liberia vs Dutch West Indian Female Poverty Among 18-24 Year Olds Correlation Chart
The statistical analysis conducted on geographies consisting of 134,229,994 people shows a weak positive correlation between the proportion of Immigrants from Liberia and poverty level among females between the ages 18 and 24 in the United States with a correlation coefficient (R) of 0.296 and weighted average of 20.7%. Similarly, the statistical analysis conducted on geographies consisting of 85,171,032 people shows a moderate positive correlation between the proportion of Dutch West Indians and poverty level among females between the ages 18 and 24 in the United States with a correlation coefficient (R) of 0.440 and weighted average of 24.5%, a difference of 18.3%.
Female Poverty Among 18-24 Year Olds Correlation Summary
| Measurement | Immigrants from Liberia | Dutch West Indian |
| Minimum | 4.0% | 8.3% |
| Maximum | 70.3% | 100.0% |
| Range | 66.3% | 91.7% |
| Mean | 20.5% | 33.1% |
| Median | 18.5% | 28.0% |
| Interquartile 25% (IQ1) | 12.7% | 20.6% |
| Interquartile 75% (IQ3) | 23.2% | 38.9% |
| Interquartile Range (IQR) | 10.5% | 18.3% |
| Standard Deviation (Sample) | 12.3% | 22.5% |
| Standard Deviation (Population) | 12.2% | 22.0% |
Similar Demographics by Female Poverty Among 18-24 Year Olds
Demographics Similar to Immigrants from Liberia by Female Poverty Among 18-24 Year Olds
In terms of female poverty among 18-24 year olds, the demographic groups most similar to Immigrants from Liberia are French (20.7%, a difference of 0.040%), Norwegian (20.7%, a difference of 0.060%), Guatemalan (20.7%, a difference of 0.070%), Estonian (20.7%, a difference of 0.080%), and Immigrants from Sweden (20.7%, a difference of 0.15%).
| Demographics | Rating | Rank | Female Poverty Among 18-24 Year Olds |
| Immigrants | Laos | 9.7 /100 | #217 | Tragic 20.6% |
| Immigrants | Nepal | 9.6 /100 | #218 | Tragic 20.7% |
| Immigrants | Micronesia | 9.6 /100 | #219 | Tragic 20.7% |
| British | 9.4 /100 | #220 | Tragic 20.7% |
| Barbadians | 9.0 /100 | #221 | Tragic 20.7% |
| Guatemalans | 8.1 /100 | #222 | Tragic 20.7% |
| French | 7.9 /100 | #223 | Tragic 20.7% |
| Immigrants | Liberia | 7.6 /100 | #224 | Tragic 20.7% |
| Norwegians | 7.3 /100 | #225 | Tragic 20.7% |
| Estonians | 7.2 /100 | #226 | Tragic 20.7% |
| Immigrants | Sweden | 6.8 /100 | #227 | Tragic 20.7% |
| Ghanaians | 6.5 /100 | #228 | Tragic 20.8% |
| Australians | 6.1 /100 | #229 | Tragic 20.8% |
| Whites/Caucasians | 6.1 /100 | #230 | Tragic 20.8% |
| Immigrants | St. Vincent and the Grenadines | 6.0 /100 | #231 | Tragic 20.8% |
Demographics Similar to Dutch West Indians by Female Poverty Among 18-24 Year Olds
In terms of female poverty among 18-24 year olds, the demographic groups most similar to Dutch West Indians are Chickasaw (24.5%, a difference of 0.10%), Osage (24.5%, a difference of 0.18%), Immigrants from Congo (24.6%, a difference of 0.30%), Alsatian (24.4%, a difference of 0.48%), and Black/African American (24.3%, a difference of 0.79%).
| Demographics | Rating | Rank | Female Poverty Among 18-24 Year Olds |
| Yuman | 0.0 /100 | #312 | Tragic 24.0% |
| Creek | 0.0 /100 | #313 | Tragic 24.2% |
| Choctaw | 0.0 /100 | #314 | Tragic 24.3% |
| Blacks/African Americans | 0.0 /100 | #315 | Tragic 24.3% |
| Alsatians | 0.0 /100 | #316 | Tragic 24.4% |
| Osage | 0.0 /100 | #317 | Tragic 24.5% |
| Chickasaw | 0.0 /100 | #318 | Tragic 24.5% |
| Dutch West Indians | 0.0 /100 | #319 | Tragic 24.5% |
| Immigrants | Congo | 0.0 /100 | #320 | Tragic 24.6% |
| Immigrants | Zaire | 0.0 /100 | #321 | Tragic 25.1% |
| Somalis | 0.0 /100 | #322 | Tragic 25.1% |
| Arapaho | 0.0 /100 | #323 | Tragic 25.2% |
| German Russians | 0.0 /100 | #324 | Tragic 25.2% |
| Immigrants | Saudi Arabia | 0.0 /100 | #325 | Tragic 25.3% |
| Yakama | 0.0 /100 | #326 | Tragic 25.3% |