Argentinean vs Immigrants from Israel Self-Care Disability
COMPARE
Argentinean
Immigrants from Israel
Self-Care Disability
Self-Care Disability Comparison
Argentineans
Immigrants from Israel
2.3%
SELF-CARE DISABILITY
99.6/ 100
METRIC RATING
54th/ 347
METRIC RANK
2.4%
SELF-CARE DISABILITY
96.1/ 100
METRIC RATING
99th/ 347
METRIC RANK
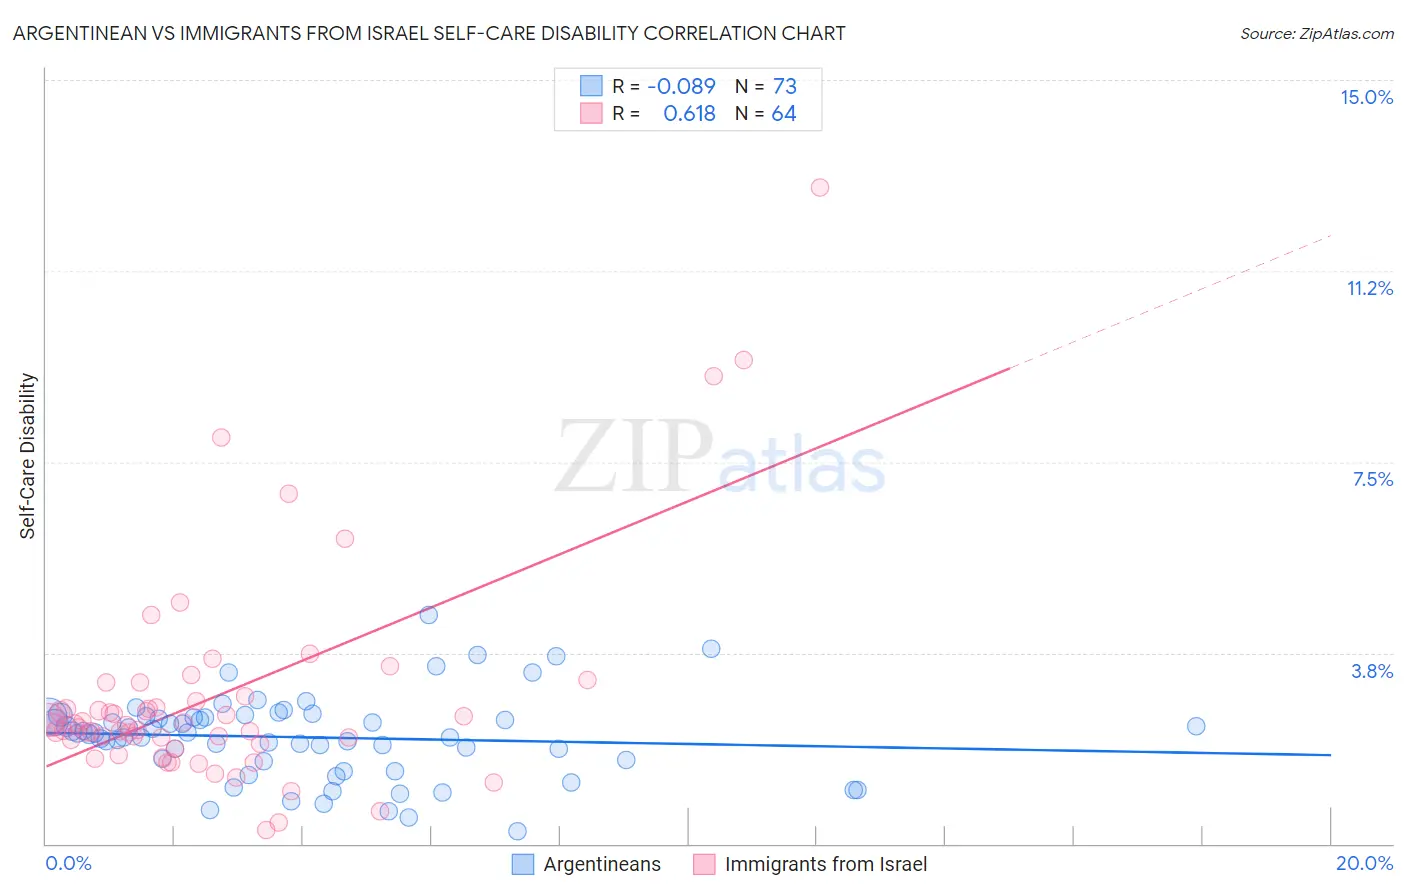
Argentinean vs Immigrants from Israel Self-Care Disability Correlation Chart
The statistical analysis conducted on geographies consisting of 296,904,932 people shows a slight negative correlation between the proportion of Argentineans and percentage of population with self-care disability in the United States with a correlation coefficient (R) of -0.089 and weighted average of 2.3%. Similarly, the statistical analysis conducted on geographies consisting of 209,935,200 people shows a significant positive correlation between the proportion of Immigrants from Israel and percentage of population with self-care disability in the United States with a correlation coefficient (R) of 0.618 and weighted average of 2.4%, a difference of 3.0%.
Self-Care Disability Correlation Summary
| Measurement | Argentinean | Immigrants from Israel |
| Minimum | 0.24% | 0.28% |
| Maximum | 4.5% | 12.9% |
| Range | 4.2% | 12.6% |
| Mean | 2.1% | 2.9% |
| Median | 2.2% | 2.3% |
| Interquartile 25% (IQ1) | 1.6% | 2.0% |
| Interquartile 75% (IQ3) | 2.5% | 2.8% |
| Interquartile Range (IQR) | 0.85% | 0.83% |
| Standard Deviation (Sample) | 0.81% | 2.2% |
| Standard Deviation (Population) | 0.80% | 2.1% |
Similar Demographics by Self-Care Disability
Demographics Similar to Argentineans by Self-Care Disability
In terms of self-care disability, the demographic groups most similar to Argentineans are Australian (2.3%, a difference of 0.050%), Immigrants from France (2.3%, a difference of 0.060%), Immigrants from Serbia (2.3%, a difference of 0.080%), Kenyan (2.3%, a difference of 0.10%), and Immigrants from Eastern Asia (2.3%, a difference of 0.10%).
| Demographics | Rating | Rank | Self-Care Disability |
| Jordanians | 99.7 /100 | #47 | Exceptional 2.3% |
| Immigrants | Malaysia | 99.7 /100 | #48 | Exceptional 2.3% |
| Latvians | 99.7 /100 | #49 | Exceptional 2.3% |
| Immigrants | Brazil | 99.7 /100 | #50 | Exceptional 2.3% |
| Kenyans | 99.7 /100 | #51 | Exceptional 2.3% |
| Immigrants | Serbia | 99.6 /100 | #52 | Exceptional 2.3% |
| Australians | 99.6 /100 | #53 | Exceptional 2.3% |
| Argentineans | 99.6 /100 | #54 | Exceptional 2.3% |
| Immigrants | France | 99.6 /100 | #55 | Exceptional 2.3% |
| Immigrants | Eastern Asia | 99.6 /100 | #56 | Exceptional 2.3% |
| Immigrants | Belgium | 99.6 /100 | #57 | Exceptional 2.3% |
| Immigrants | Cameroon | 99.6 /100 | #58 | Exceptional 2.3% |
| New Zealanders | 99.5 /100 | #59 | Exceptional 2.3% |
| Immigrants | Japan | 99.5 /100 | #60 | Exceptional 2.3% |
| Palestinians | 99.4 /100 | #61 | Exceptional 2.3% |
Demographics Similar to Immigrants from Israel by Self-Care Disability
In terms of self-care disability, the demographic groups most similar to Immigrants from Israel are Immigrants from Poland (2.4%, a difference of 0.080%), European (2.4%, a difference of 0.10%), Immigrants from Scotland (2.4%, a difference of 0.15%), Swiss (2.4%, a difference of 0.17%), and Immigrants from Chile (2.4%, a difference of 0.21%).
| Demographics | Rating | Rank | Self-Care Disability |
| Icelanders | 97.4 /100 | #92 | Exceptional 2.4% |
| Immigrants | Latvia | 97.0 /100 | #93 | Exceptional 2.4% |
| Macedonians | 96.9 /100 | #94 | Exceptional 2.4% |
| Immigrants | Asia | 96.9 /100 | #95 | Exceptional 2.4% |
| Immigrants | Chile | 96.7 /100 | #96 | Exceptional 2.4% |
| Swiss | 96.6 /100 | #97 | Exceptional 2.4% |
| Immigrants | Poland | 96.4 /100 | #98 | Exceptional 2.4% |
| Immigrants | Israel | 96.1 /100 | #99 | Exceptional 2.4% |
| Europeans | 95.8 /100 | #100 | Exceptional 2.4% |
| Immigrants | Scotland | 95.7 /100 | #101 | Exceptional 2.4% |
| Croatians | 95.0 /100 | #102 | Exceptional 2.4% |
| Alsatians | 94.9 /100 | #103 | Exceptional 2.4% |
| Bhutanese | 94.5 /100 | #104 | Exceptional 2.4% |
| Carpatho Rusyns | 94.4 /100 | #105 | Exceptional 2.4% |
| Immigrants | Indonesia | 94.3 /100 | #106 | Exceptional 2.4% |