Arapaho vs Arab Child Poverty Among Girls Under 16
COMPARE
Arapaho
Arab
Child Poverty Among Girls Under 16
Child Poverty Among Girls Under 16 Comparison
Arapaho
Arabs
21.7%
CHILD POVERTY AMONG GIRLS UNDER 16
0.0/ 100
METRIC RATING
314th/ 347
METRIC RANK
16.8%
CHILD POVERTY AMONG GIRLS UNDER 16
34.5/ 100
METRIC RATING
188th/ 347
METRIC RANK
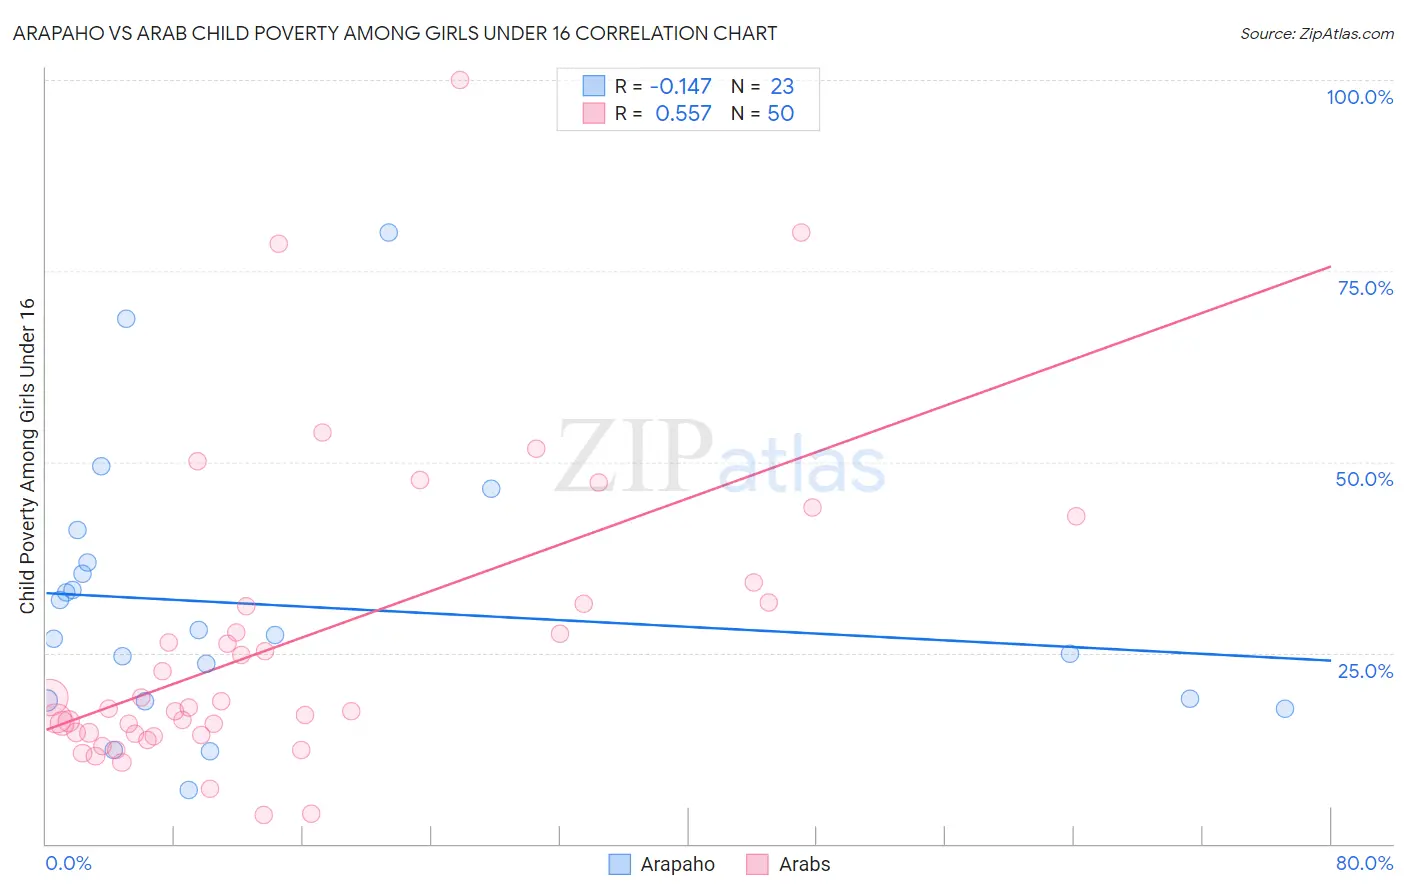
Arapaho vs Arab Child Poverty Among Girls Under 16 Correlation Chart
The statistical analysis conducted on geographies consisting of 29,689,796 people shows a poor negative correlation between the proportion of Arapaho and poverty level among girls under the age of 16 in the United States with a correlation coefficient (R) of -0.147 and weighted average of 21.7%. Similarly, the statistical analysis conducted on geographies consisting of 474,430,772 people shows a substantial positive correlation between the proportion of Arabs and poverty level among girls under the age of 16 in the United States with a correlation coefficient (R) of 0.557 and weighted average of 16.8%, a difference of 29.6%.
Child Poverty Among Girls Under 16 Correlation Summary
| Measurement | Arapaho | Arab |
| Minimum | 7.0% | 3.7% |
| Maximum | 80.0% | 100.0% |
| Range | 73.0% | 96.3% |
| Mean | 31.1% | 26.3% |
| Median | 27.3% | 17.8% |
| Interquartile 25% (IQ1) | 18.8% | 14.5% |
| Interquartile 75% (IQ3) | 36.8% | 31.4% |
| Interquartile Range (IQR) | 18.0% | 17.0% |
| Standard Deviation (Sample) | 17.4% | 19.9% |
| Standard Deviation (Population) | 17.0% | 19.7% |
Similar Demographics by Child Poverty Among Girls Under 16
Demographics Similar to Arapaho by Child Poverty Among Girls Under 16
In terms of child poverty among girls under 16, the demographic groups most similar to Arapaho are Creek (21.7%, a difference of 0.010%), Ute (21.8%, a difference of 0.28%), Immigrants from Mexico (21.6%, a difference of 0.51%), Immigrants from Guatemala (21.9%, a difference of 0.55%), and Dutch West Indian (21.6%, a difference of 0.75%).
| Demographics | Rating | Rank | Child Poverty Among Girls Under 16 |
| Immigrants | Bahamas | 0.0 /100 | #307 | Tragic 21.4% |
| Houma | 0.0 /100 | #308 | Tragic 21.5% |
| Bahamians | 0.0 /100 | #309 | Tragic 21.5% |
| Immigrants | Somalia | 0.0 /100 | #310 | Tragic 21.6% |
| Dutch West Indians | 0.0 /100 | #311 | Tragic 21.6% |
| Immigrants | Mexico | 0.0 /100 | #312 | Tragic 21.6% |
| Creek | 0.0 /100 | #313 | Tragic 21.7% |
| Arapaho | 0.0 /100 | #314 | Tragic 21.7% |
| Ute | 0.0 /100 | #315 | Tragic 21.8% |
| Immigrants | Guatemala | 0.0 /100 | #316 | Tragic 21.9% |
| Africans | 0.0 /100 | #317 | Tragic 21.9% |
| Immigrants | Dominica | 0.0 /100 | #318 | Tragic 22.1% |
| U.S. Virgin Islanders | 0.0 /100 | #319 | Tragic 22.1% |
| Hondurans | 0.0 /100 | #320 | Tragic 22.2% |
| Colville | 0.0 /100 | #321 | Tragic 22.5% |
Demographics Similar to Arabs by Child Poverty Among Girls Under 16
In terms of child poverty among girls under 16, the demographic groups most similar to Arabs are Immigrants from Morocco (16.8%, a difference of 0.010%), South American Indian (16.8%, a difference of 0.060%), Immigrants from Uruguay (16.7%, a difference of 0.13%), Immigrants from Bosnia and Herzegovina (16.8%, a difference of 0.25%), and Kenyan (16.8%, a difference of 0.29%).
| Demographics | Rating | Rank | Child Poverty Among Girls Under 16 |
| Immigrants | Iraq | 43.2 /100 | #181 | Average 16.6% |
| Immigrants | Ethiopia | 43.1 /100 | #182 | Average 16.6% |
| Immigrants | Portugal | 42.5 /100 | #183 | Average 16.6% |
| Scotch-Irish | 39.6 /100 | #184 | Fair 16.7% |
| Immigrants | Uruguay | 35.6 /100 | #185 | Fair 16.7% |
| South American Indians | 35.0 /100 | #186 | Fair 16.8% |
| Immigrants | Morocco | 34.6 /100 | #187 | Fair 16.8% |
| Arabs | 34.5 /100 | #188 | Fair 16.8% |
| Immigrants | Bosnia and Herzegovina | 32.5 /100 | #189 | Fair 16.8% |
| Kenyans | 32.3 /100 | #190 | Fair 16.8% |
| Immigrants | Azores | 31.3 /100 | #191 | Fair 16.8% |
| Immigrants | Uganda | 31.3 /100 | #192 | Fair 16.8% |
| Aleuts | 28.7 /100 | #193 | Fair 16.9% |
| Spanish | 28.6 /100 | #194 | Fair 16.9% |
| Immigrants | Costa Rica | 25.6 /100 | #195 | Fair 17.0% |