Arapaho vs Greek Seniors Poverty Over the Age of 65
COMPARE
Arapaho
Greek
Seniors Poverty Over the Age of 65
Seniors Poverty Over the Age of 65 Comparison
Arapaho
Greeks
11.6%
SENIORS POVERTY OVER THE AGE OF 65
5.2/ 100
METRIC RATING
219th/ 347
METRIC RANK
9.6%
SENIORS POVERTY OVER THE AGE OF 65
99.6/ 100
METRIC RATING
39th/ 347
METRIC RANK
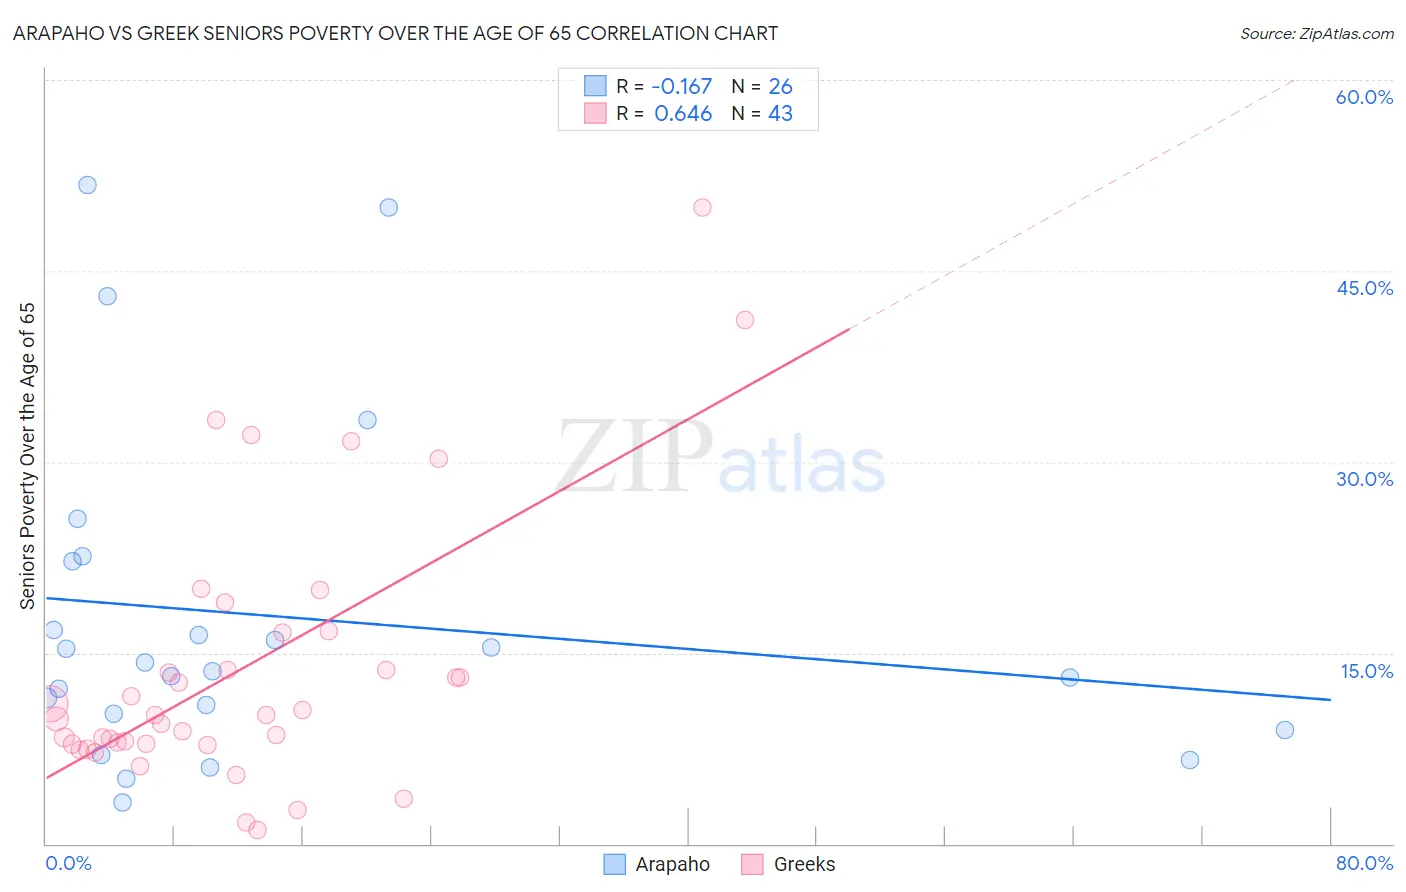
Arapaho vs Greek Seniors Poverty Over the Age of 65 Correlation Chart
The statistical analysis conducted on geographies consisting of 29,765,884 people shows a poor negative correlation between the proportion of Arapaho and poverty level among seniors over the age of 65 in the United States with a correlation coefficient (R) of -0.167 and weighted average of 11.6%. Similarly, the statistical analysis conducted on geographies consisting of 480,237,889 people shows a significant positive correlation between the proportion of Greeks and poverty level among seniors over the age of 65 in the United States with a correlation coefficient (R) of 0.646 and weighted average of 9.6%, a difference of 21.6%.
Seniors Poverty Over the Age of 65 Correlation Summary
| Measurement | Arapaho | Greek |
| Minimum | 3.2% | 1.0% |
| Maximum | 51.7% | 50.0% |
| Range | 48.5% | 49.0% |
| Mean | 17.8% | 13.7% |
| Median | 13.9% | 10.1% |
| Interquartile 25% (IQ1) | 10.2% | 7.8% |
| Interquartile 75% (IQ3) | 22.2% | 16.6% |
| Interquartile Range (IQR) | 12.0% | 8.8% |
| Standard Deviation (Sample) | 13.1% | 10.6% |
| Standard Deviation (Population) | 12.8% | 10.4% |
Similar Demographics by Seniors Poverty Over the Age of 65
Demographics Similar to Arapaho by Seniors Poverty Over the Age of 65
In terms of seniors poverty over the age of 65, the demographic groups most similar to Arapaho are Immigrants from Ukraine (11.6%, a difference of 0.18%), Immigrants from Africa (11.6%, a difference of 0.45%), Peruvian (11.7%, a difference of 0.48%), Argentinean (11.7%, a difference of 0.55%), and Immigrants from Morocco (11.6%, a difference of 0.59%).
| Demographics | Rating | Rank | Seniors Poverty Over the Age of 65 |
| Immigrants | China | 9.5 /100 | #212 | Tragic 11.5% |
| Nepalese | 8.9 /100 | #213 | Tragic 11.5% |
| Immigrants | Russia | 8.8 /100 | #214 | Tragic 11.5% |
| French American Indians | 8.7 /100 | #215 | Tragic 11.5% |
| Immigrants | Morocco | 6.8 /100 | #216 | Tragic 11.6% |
| Immigrants | Africa | 6.4 /100 | #217 | Tragic 11.6% |
| Immigrants | Ukraine | 5.7 /100 | #218 | Tragic 11.6% |
| Arapaho | 5.2 /100 | #219 | Tragic 11.6% |
| Peruvians | 4.2 /100 | #220 | Tragic 11.7% |
| Argentineans | 4.1 /100 | #221 | Tragic 11.7% |
| Immigrants | Chile | 3.9 /100 | #222 | Tragic 11.7% |
| Immigrants | Congo | 3.8 /100 | #223 | Tragic 11.7% |
| Immigrants | Nigeria | 3.4 /100 | #224 | Tragic 11.7% |
| Immigrants | Belarus | 3.2 /100 | #225 | Tragic 11.8% |
| Liberians | 3.2 /100 | #226 | Tragic 11.8% |
Demographics Similar to Greeks by Seniors Poverty Over the Age of 65
In terms of seniors poverty over the age of 65, the demographic groups most similar to Greeks are Assyrian/Chaldean/Syriac (9.6%, a difference of 0.12%), Immigrants from North Macedonia (9.6%, a difference of 0.28%), Zimbabwean (9.6%, a difference of 0.44%), Eastern European (9.6%, a difference of 0.54%), and Belgian (9.5%, a difference of 0.63%).
| Demographics | Rating | Rank | Seniors Poverty Over the Age of 65 |
| Northern Europeans | 99.8 /100 | #32 | Exceptional 9.4% |
| Native Hawaiians | 99.8 /100 | #33 | Exceptional 9.4% |
| British | 99.8 /100 | #34 | Exceptional 9.4% |
| Latvians | 99.8 /100 | #35 | Exceptional 9.5% |
| Czechoslovakians | 99.8 /100 | #36 | Exceptional 9.5% |
| Scotch-Irish | 99.7 /100 | #37 | Exceptional 9.5% |
| Belgians | 99.7 /100 | #38 | Exceptional 9.5% |
| Greeks | 99.6 /100 | #39 | Exceptional 9.6% |
| Assyrians/Chaldeans/Syriacs | 99.6 /100 | #40 | Exceptional 9.6% |
| Immigrants | North Macedonia | 99.6 /100 | #41 | Exceptional 9.6% |
| Zimbabweans | 99.6 /100 | #42 | Exceptional 9.6% |
| Eastern Europeans | 99.6 /100 | #43 | Exceptional 9.6% |
| Austrians | 99.5 /100 | #44 | Exceptional 9.6% |
| Estonians | 99.5 /100 | #45 | Exceptional 9.6% |
| Immigrants | Taiwan | 99.5 /100 | #46 | Exceptional 9.7% |