Arapaho vs Immigrants from Caribbean Seniors Poverty Over the Age of 65

COMPARE

Arapaho
Race
Ancestry
AfghanAfricanAlaska NativeAlaskan AthabascanAlbanianAleutAlsatianAmericanApacheArabArapahoArgentineanArmenianAssyrian/Chaldean/SyriacAustralianAustrianBahamianBangladeshiBarbadianBasqueBelgianBelizeanBermudanBhutaneseBlackfeetBolivianBrazilianBritishBritish West IndianBulgarianBurmeseCajunCambodianCanadianCape VerdeanCarpatho RusynCelticCentral AmericanCentral American IndianCherokeeCheyenneChickasawChileanChineseChippewaChoctawColombianColvilleComancheCosta RicanCreeCreekCroatianCrowCubanCypriotCzechCzechoslovakianDanishDelawareDominicanDutchDutch West IndianEastern EuropeanEcuadorianEgyptianEnglishEstonianEthiopianEuropeanFijianFilipinoFinnishFrenchFrench American IndianFrench CanadianGermanGerman RussianGhanaianGreekGuamanian/ChamorroGuatemalanGuyaneseHaitianHmongHonduranHopiHoumaHungarianIcelanderIndian (Asian)IndonesianInupiatIranianIraqiIrishIroquoisIsraeliItalianJamaicanJapaneseJordanianKenyanKiowaKoreanLaotianLatvianLebaneseLiberianLithuanianLumbeeLuxembourgerMacedonianMalaysianMalteseMarshalleseMenomineeMexicanMexican American IndianMongolianMoroccanNative HawaiianNavajoNepaleseNew ZealanderNicaraguanNigerianNorthern EuropeanNorwegianOkinawanOsageOttawaPaiutePakistaniPalestinianPanamanianParaguayanPennsylvania GermanPeruvianPimaPolishPortuguesePotawatomiPuebloPuerto RicanPuget Sound SalishRomanianRussianSalvadoranSamoanScandinavianScotch-IrishScottishSeminoleSenegaleseSerbianShoshoneSierra LeoneanSiouxSlavicSlovakSloveneSomaliSouth AfricanSouth AmericanSouth American IndianSoviet UnionSpaniardSpanishSpanish AmericanSpanish American IndianSri LankanSubsaharan AfricanSudaneseSwedishSwissSyrianTaiwaneseThaiTlingit-HaidaTohono O'OdhamTonganTrinidadian and TobagonianTsimshianTurkishU.S. Virgin IslanderUgandanUkrainianUruguayanUteVenezuelanVietnameseWelshWest IndianYakamaYaquiYugoslavianYumanYup'ikZimbabwean
Immigration
NonimmigrantsImmigrantsAfghanistanAfricaAlbaniaArgentinaArmeniaAsiaAustraliaAustriaBahamasBangladeshBarbadosBelarusBelgiumBelizeBoliviaBosnia and HerzegovinaBrazilBulgariaBurma/MyanmarCabo VerdeCambodiaCameroonCanadaCentral AmericaChileChinaColombiaCongoCosta RicaCroatiaCubaCzechoslovakiaDenmarkDominicaDominican RepublicEastern AfricaEastern AsiaEastern EuropeEcuadorEgyptEl SalvadorEnglandEritreaEthiopiaEuropeFijiFranceGermanyGhanaGreeceGrenadaGuatemalaGuyanaHaitiHondurasHong KongHungaryIndiaIndonesiaIranIraqIrelandIsraelItalyJamaicaJapanJordanKazakhstanKenyaKoreaKuwaitLaosLatin AmericaLatviaLebanonLiberiaLithuaniaMalaysiaMexicoMicronesiaMiddle AfricaMoldovaMoroccoNepalNetherlandsNicaraguaNigeriaNorth AmericaNorth MacedoniaNorthern AfricaNorthern EuropeNorwayOceaniaPakistanPanamaPeruPhilippinesPolandPortugalRomaniaRussiaSaudi ArabiaScotlandSenegalSerbiaSierra LeoneSingaporeSomaliaSouth AfricaSouth AmericaSouth Central AsiaSouth Eastern AsiaSouthern EuropeSpainSri LankaSt. Vincent and the GrenadinesSudanSwedenSwitzerlandSyriaTaiwanThailandTrinidad and TobagoTurkeyUgandaUkraineUruguayUzbekistanVenezuelaVietnamWest IndiesWestern AfricaWestern AsiaWestern EuropeYemenZaireZimbabweAzores
Immigrants from Caribbean
Race
Ancestry
AfghanAfricanAlaska NativeAlaskan AthabascanAlbanianAleutAlsatianAmericanApacheArabArgentineanArmenianAssyrian/Chaldean/SyriacAustralianAustrianBahamianBangladeshiBarbadianBasqueBelgianBelizeanBermudanBhutaneseBlackfeetBolivianBrazilianBritishBritish West IndianBulgarianBurmeseCajunCambodianCanadianCape VerdeanCarpatho RusynCelticCentral AmericanCentral American IndianCherokeeCheyenneChickasawChileanChineseChippewaChoctawColombianColvilleComancheCosta RicanCreeCreekCroatianCrowCubanCypriotCzechCzechoslovakianDanishDelawareDominicanDutchDutch West IndianEastern EuropeanEcuadorianEgyptianEnglishEstonianEthiopianEuropeanFijianFilipinoFinnishFrenchFrench American IndianFrench CanadianGermanGerman RussianGhanaianGreekGuamanian/ChamorroGuatemalanGuyaneseHaitianHmongHonduranHopiHoumaHungarianIcelanderIndian (Asian)IndonesianInupiatIranianIraqiIrishIroquoisIsraeliItalianJamaicanJapaneseJordanianKenyanKiowaKoreanLaotianLatvianLebaneseLiberianLithuanianLumbeeLuxembourgerMacedonianMalaysianMalteseMarshalleseMenomineeMexicanMexican American IndianMongolianMoroccanNative HawaiianNavajoNepaleseNew ZealanderNicaraguanNigerianNorthern EuropeanNorwegianOkinawanOsageOttawaPaiutePakistaniPalestinianPanamanianParaguayanPennsylvania GermanPeruvianPimaPolishPortuguesePotawatomiPuebloPuerto RicanPuget Sound SalishRomanianRussianSalvadoranSamoanScandinavianScotch-IrishScottishSeminoleSenegaleseSerbianShoshoneSierra LeoneanSiouxSlavicSlovakSloveneSomaliSouth AfricanSouth AmericanSouth American IndianSoviet UnionSpaniardSpanishSpanish AmericanSpanish American IndianSri LankanSubsaharan AfricanSudaneseSwedishSwissSyrianTaiwaneseThaiTlingit-HaidaTohono O'OdhamTonganTrinidadian and TobagonianTsimshianTurkishU.S. Virgin IslanderUgandanUkrainianUruguayanUteVenezuelanVietnameseWelshWest IndianYakamaYaquiYugoslavianYumanYup'ikZimbabwean
Immigration
NonimmigrantsImmigrantsAfghanistanAfricaAlbaniaArgentinaArmeniaAsiaAustraliaAustriaBahamasBangladeshBarbadosBelarusBelgiumBelizeBoliviaBosnia and HerzegovinaBrazilBulgariaBurma/MyanmarCabo VerdeCambodiaCameroonCanadaCaribbeanCentral AmericaChileChinaColombiaCongoCosta RicaCroatiaCubaCzechoslovakiaDenmarkDominicaDominican RepublicEastern AfricaEastern AsiaEastern EuropeEcuadorEgyptEl SalvadorEnglandEritreaEthiopiaEuropeFijiFranceGermanyGhanaGreeceGrenadaGuatemalaGuyanaHaitiHondurasHong KongHungaryIndiaIndonesiaIranIraqIrelandIsraelItalyJamaicaJapanJordanKazakhstanKenyaKoreaKuwaitLaosLatin AmericaLatviaLebanonLiberiaLithuaniaMalaysiaMexicoMicronesiaMiddle AfricaMoldovaMoroccoNepalNetherlandsNicaraguaNigeriaNorth AmericaNorth MacedoniaNorthern AfricaNorthern EuropeNorwayOceaniaPakistanPanamaPeruPhilippinesPolandPortugalRomaniaRussiaSaudi ArabiaScotlandSenegalSerbiaSierra LeoneSingaporeSomaliaSouth AfricaSouth AmericaSouth Central AsiaSouth Eastern AsiaSouthern EuropeSpainSri LankaSt. Vincent and the GrenadinesSudanSwedenSwitzerlandSyriaTaiwanThailandTrinidad and TobagoTurkeyUgandaUkraineUruguayUzbekistanVenezuelaVietnamWest IndiesWestern AfricaWestern AsiaWestern EuropeYemenZaireZimbabweAzores
Seniors Poverty Over the Age of 65
Income
Poverty
Unemployment
Labor Participation
Family Structure
Vehicle Availability
Education Level
Disability

Seniors Poverty Over the Age of 65 Comparison

Arapaho

Immigrants from Caribbean

Tragic
Tragic
11.6%
SENIORS POVERTY OVER THE AGE OF 65
5.2/ 100
METRIC RATING
219th/ 347
METRIC RANK
16.5%
SENIORS POVERTY OVER THE AGE OF 65
0.0/ 100
METRIC RATING
337th/ 347
METRIC RANK

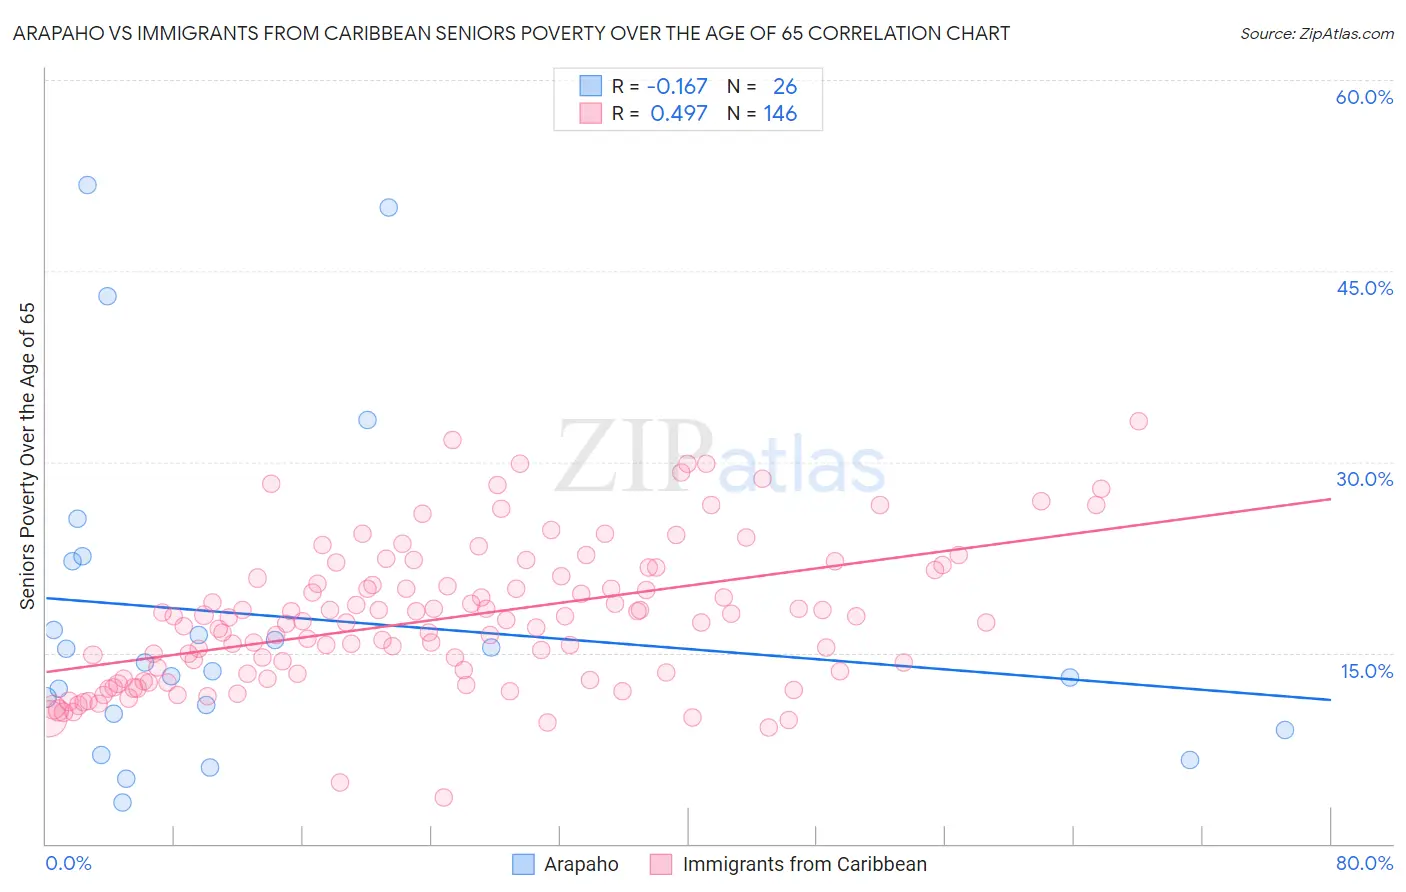
Arapaho vs Immigrants from Caribbean Seniors Poverty Over the Age of 65 Correlation Chart

The statistical analysis conducted on geographies consisting of 29,765,884 people shows a poor negative correlation between the proportion of Arapaho and poverty level among seniors over the age of 65 in the United States with a correlation coefficient (R) of -0.167 and weighted average of 11.6%. Similarly, the statistical analysis conducted on geographies consisting of 447,867,383 people shows a moderate positive correlation between the proportion of Immigrants from Caribbean and poverty level among seniors over the age of 65 in the United States with a correlation coefficient (R) of 0.497 and weighted average of 16.5%, a difference of 41.7%.
Arapaho vs Immigrants from Caribbean Seniors Poverty Over the Age of 65

Seniors Poverty Over the Age of 65 Correlation Summary

MeasurementArapahoImmigrants from Caribbean
Minimum3.2%3.6%
Maximum51.7%33.2%
Range48.5%29.5%
Mean17.8%17.7%
Median13.9%17.5%
Interquartile 25% (IQ1)10.2%13.4%
Interquartile 75% (IQ3)22.2%20.9%
Interquartile Range (IQR)12.0%7.5%
Standard Deviation (Sample)13.1%5.6%
Standard Deviation (Population)12.8%5.6%

Similar Demographics by Seniors Poverty Over the Age of 65

Demographics Similar to Arapaho by Seniors Poverty Over the Age of 65

In terms of seniors poverty over the age of 65, the demographic groups most similar to Arapaho are Immigrants from Ukraine (11.6%, a difference of 0.18%), Immigrants from Africa (11.6%, a difference of 0.45%), Peruvian (11.7%, a difference of 0.48%), Argentinean (11.7%, a difference of 0.55%), and Immigrants from Morocco (11.6%, a difference of 0.59%).
DemographicsRating | RankSeniors Poverty Over the Age of 65
Immigrants | China
9.5
/100
|
#212
Tragic
11.5%
Nepalese
8.9
/100
|
#213
Tragic
11.5%
Immigrants | Russia
8.8
/100
|
#214
Tragic
11.5%
French American Indians
8.7
/100
|
#215
Tragic
11.5%
Immigrants | Morocco
6.8
/100
|
#216
Tragic
11.6%
Immigrants | Africa
6.4
/100
|
#217
Tragic
11.6%
Immigrants | Ukraine
5.7
/100
|
#218
Tragic
11.6%
Arapaho
5.2
/100
|
#219
Tragic
11.6%
Peruvians
4.2
/100
|
#220
Tragic
11.7%
Argentineans
4.1
/100
|
#221
Tragic
11.7%
Immigrants | Chile
3.9
/100
|
#222
Tragic
11.7%
Immigrants | Congo
3.8
/100
|
#223
Tragic
11.7%
Immigrants | Nigeria
3.4
/100
|
#224
Tragic
11.7%
Immigrants | Belarus
3.2
/100
|
#225
Tragic
11.8%
Liberians
3.2
/100
|
#226
Tragic
11.8%

Demographics Similar to Immigrants from Caribbean by Seniors Poverty Over the Age of 65

In terms of seniors poverty over the age of 65, the demographic groups most similar to Immigrants from Caribbean are Immigrants from Cabo Verde (16.2%, a difference of 1.8%), Cuban (16.1%, a difference of 2.4%), Immigrants from Nicaragua (15.9%, a difference of 3.7%), Immigrants from Yemen (15.9%, a difference of 3.9%), and Pueblo (17.2%, a difference of 4.2%).
DemographicsRating | RankSeniors Poverty Over the Age of 65
Immigrants | St. Vincent and the Grenadines
0.0
/100
|
#330
Tragic
15.5%
British West Indians
0.0
/100
|
#331
Tragic
15.6%
Immigrants | Grenada
0.0
/100
|
#332
Tragic
15.8%
Immigrants | Yemen
0.0
/100
|
#333
Tragic
15.9%
Immigrants | Nicaragua
0.0
/100
|
#334
Tragic
15.9%
Cubans
0.0
/100
|
#335
Tragic
16.1%
Immigrants | Cabo Verde
0.0
/100
|
#336
Tragic
16.2%
Immigrants | Caribbean
0.0
/100
|
#337
Tragic
16.5%
Pueblo
0.0
/100
|
#338
Tragic
17.2%
Navajo
0.0
/100
|
#339
Tragic
17.5%
Hopi
0.0
/100
|
#340
Tragic
17.8%
Dominicans
0.0
/100
|
#341
Tragic
17.8%
Immigrants | Cuba
0.0
/100
|
#342
Tragic
17.9%
Lumbee
0.0
/100
|
#343
Tragic
18.1%
Immigrants | Dominican Republic
0.0
/100
|
#344
Tragic
18.3%