Immigrants from Norway vs Chickasaw Seniors Poverty Over the Age of 65
COMPARE
Immigrants from Norway
Chickasaw
Seniors Poverty Over the Age of 65
Seniors Poverty Over the Age of 65 Comparison
Immigrants from Norway
Chickasaw
10.5%
SENIORS POVERTY OVER THE AGE OF 65
86.5/ 100
METRIC RATING
135th/ 347
METRIC RANK
10.7%
SENIORS POVERTY OVER THE AGE OF 65
73.6/ 100
METRIC RATING
155th/ 347
METRIC RANK
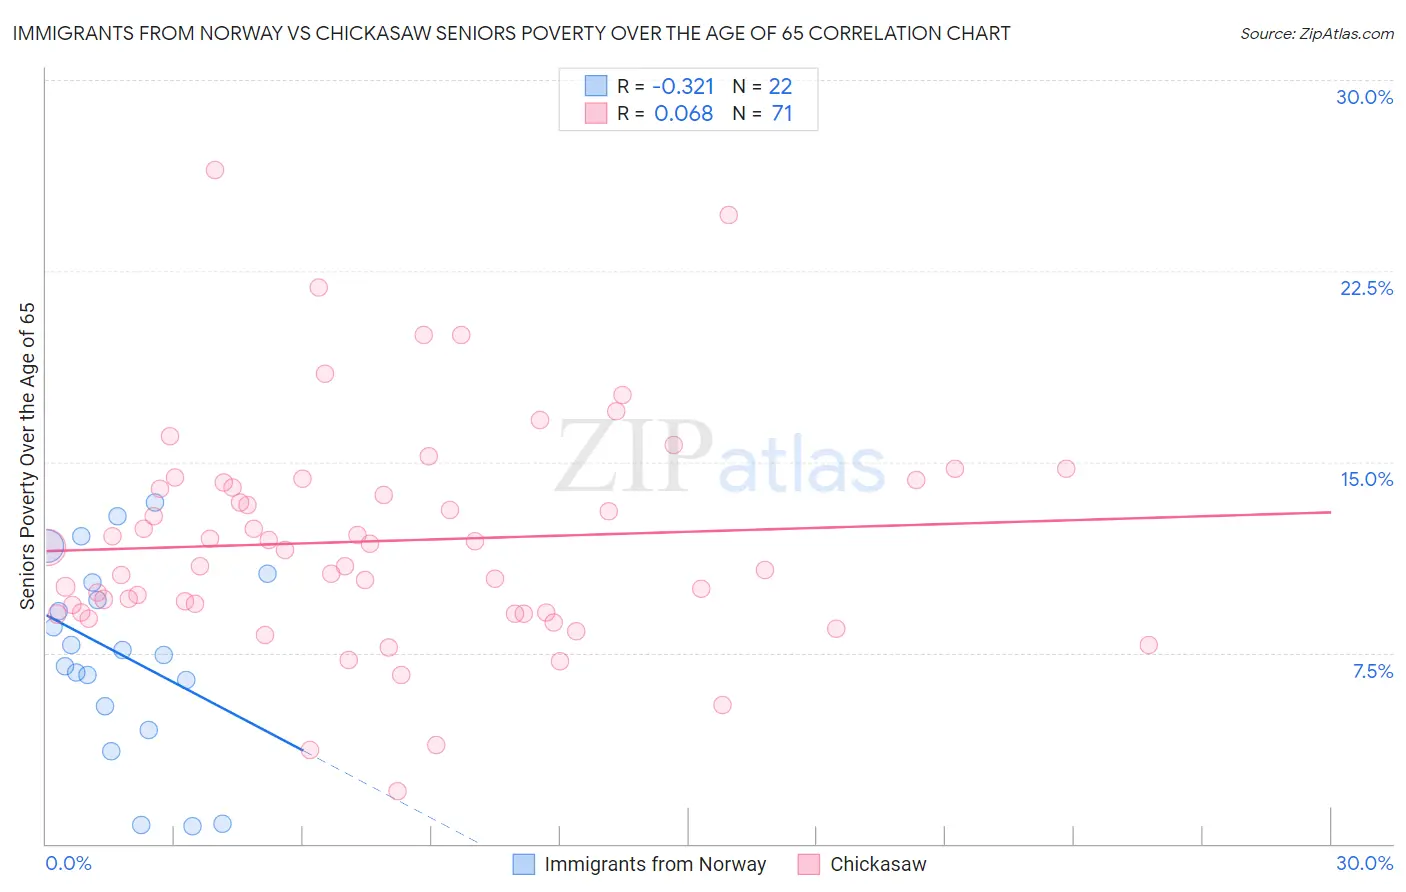
Immigrants from Norway vs Chickasaw Seniors Poverty Over the Age of 65 Correlation Chart
The statistical analysis conducted on geographies consisting of 116,590,861 people shows a mild negative correlation between the proportion of Immigrants from Norway and poverty level among seniors over the age of 65 in the United States with a correlation coefficient (R) of -0.321 and weighted average of 10.5%. Similarly, the statistical analysis conducted on geographies consisting of 147,403,073 people shows a slight positive correlation between the proportion of Chickasaw and poverty level among seniors over the age of 65 in the United States with a correlation coefficient (R) of 0.068 and weighted average of 10.7%, a difference of 1.9%.
Seniors Poverty Over the Age of 65 Correlation Summary
| Measurement | Immigrants from Norway | Chickasaw |
| Minimum | 0.71% | 2.1% |
| Maximum | 13.4% | 26.4% |
| Range | 12.7% | 24.4% |
| Mean | 7.4% | 11.9% |
| Median | 7.5% | 11.5% |
| Interquartile 25% (IQ1) | 5.4% | 9.1% |
| Interquartile 75% (IQ3) | 10.2% | 14.2% |
| Interquartile Range (IQR) | 4.9% | 5.1% |
| Standard Deviation (Sample) | 3.8% | 4.4% |
| Standard Deviation (Population) | 3.7% | 4.4% |
Demographics Similar to Immigrants from Norway and Chickasaw by Seniors Poverty Over the Age of 65
In terms of seniors poverty over the age of 65, the demographic groups most similar to Immigrants from Norway are Immigrants from Serbia (10.5%, a difference of 0.010%), Immigrants from Australia (10.5%, a difference of 0.27%), Immigrants from Latvia (10.5%, a difference of 0.33%), Portuguese (10.5%, a difference of 0.43%), and Immigrants from Kenya (10.5%, a difference of 0.56%). Similarly, the demographic groups most similar to Chickasaw are Immigrants from Saudi Arabia (10.7%, a difference of 0.16%), Fijian (10.7%, a difference of 0.24%), Immigrants from Egypt (10.6%, a difference of 0.35%), Spanish (10.6%, a difference of 0.40%), and Immigrants from Switzerland (10.6%, a difference of 0.46%).
| Demographics | Rating | Rank | Seniors Poverty Over the Age of 65 |
| Immigrants | Norway | 86.5 /100 | #135 | Excellent 10.5% |
| Immigrants | Serbia | 86.4 /100 | #136 | Excellent 10.5% |
| Immigrants | Australia | 85.1 /100 | #137 | Excellent 10.5% |
| Immigrants | Latvia | 84.7 /100 | #138 | Excellent 10.5% |
| Portuguese | 84.1 /100 | #139 | Excellent 10.5% |
| Immigrants | Kenya | 83.4 /100 | #140 | Excellent 10.5% |
| Immigrants | Europe | 83.3 /100 | #141 | Excellent 10.5% |
| Osage | 82.8 /100 | #142 | Excellent 10.6% |
| Immigrants | Asia | 80.8 /100 | #143 | Excellent 10.6% |
| Iraqis | 80.7 /100 | #144 | Excellent 10.6% |
| Laotians | 79.9 /100 | #145 | Good 10.6% |
| Alaskan Athabascans | 79.1 /100 | #146 | Good 10.6% |
| Immigrants | Greece | 79.0 /100 | #147 | Good 10.6% |
| Americans | 78.1 /100 | #148 | Good 10.6% |
| Immigrants | Cameroon | 78.1 /100 | #149 | Good 10.6% |
| Immigrants | Switzerland | 77.3 /100 | #150 | Good 10.6% |
| Spanish | 76.8 /100 | #151 | Good 10.6% |
| Immigrants | Egypt | 76.5 /100 | #152 | Good 10.6% |
| Fijians | 75.6 /100 | #153 | Good 10.7% |
| Immigrants | Saudi Arabia | 74.9 /100 | #154 | Good 10.7% |
| Chickasaw | 73.6 /100 | #155 | Good 10.7% |