Native/Alaskan vs Chickasaw Seniors Poverty Over the Age of 65
COMPARE
Native/Alaskan
Chickasaw
Seniors Poverty Over the Age of 65
Seniors Poverty Over the Age of 65 Comparison
Natives/Alaskans
Chickasaw
14.2%
SENIORS POVERTY OVER THE AGE OF 65
0.0/ 100
METRIC RATING
311th/ 347
METRIC RANK
10.7%
SENIORS POVERTY OVER THE AGE OF 65
73.6/ 100
METRIC RATING
155th/ 347
METRIC RANK
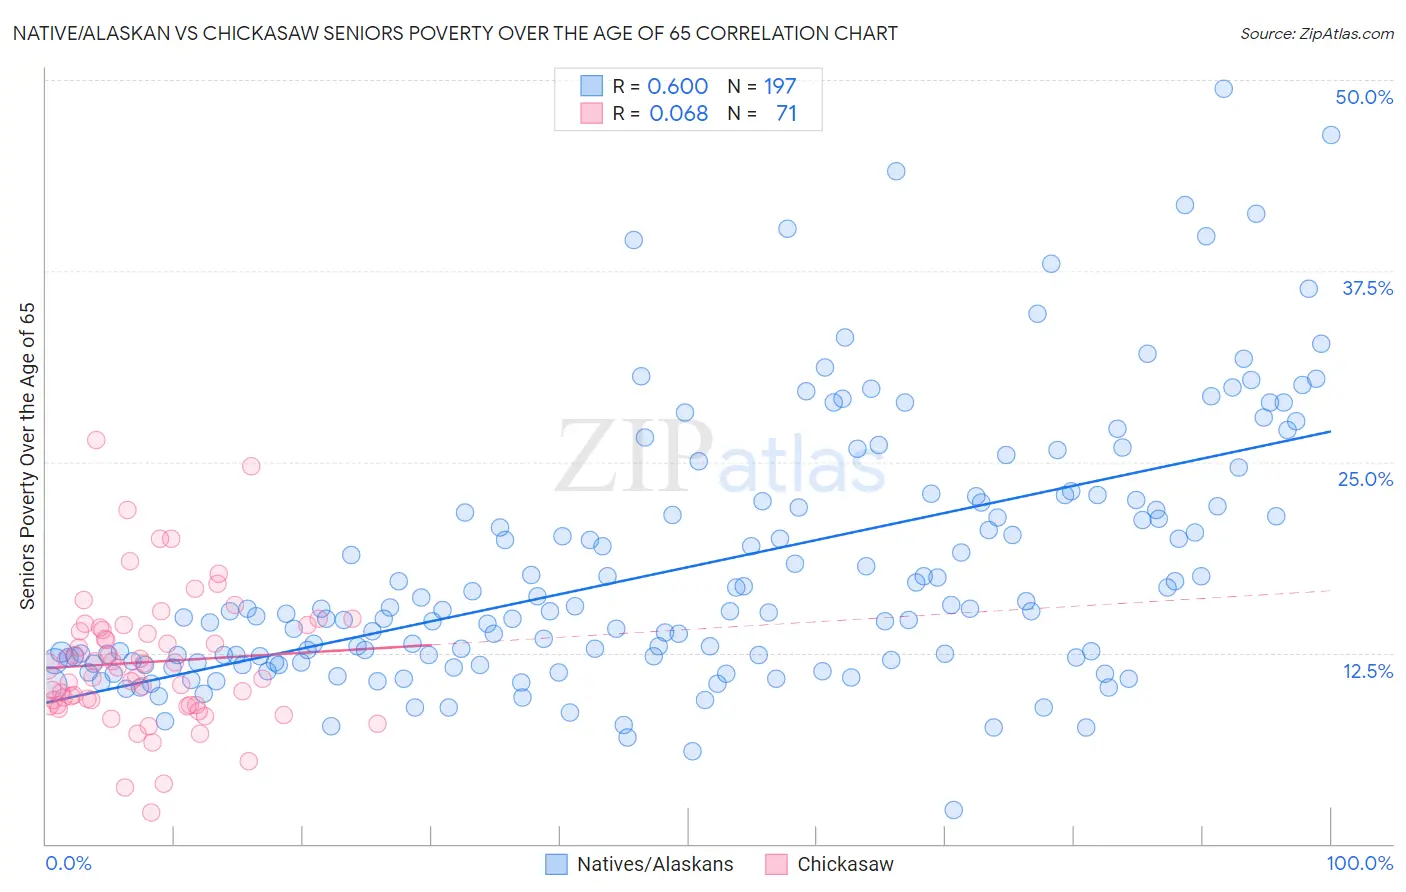
Native/Alaskan vs Chickasaw Seniors Poverty Over the Age of 65 Correlation Chart
The statistical analysis conducted on geographies consisting of 510,101,075 people shows a substantial positive correlation between the proportion of Natives/Alaskans and poverty level among seniors over the age of 65 in the United States with a correlation coefficient (R) of 0.600 and weighted average of 14.2%. Similarly, the statistical analysis conducted on geographies consisting of 147,403,073 people shows a slight positive correlation between the proportion of Chickasaw and poverty level among seniors over the age of 65 in the United States with a correlation coefficient (R) of 0.068 and weighted average of 10.7%, a difference of 33.2%.
Seniors Poverty Over the Age of 65 Correlation Summary
| Measurement | Native/Alaskan | Chickasaw |
| Minimum | 2.2% | 2.1% |
| Maximum | 49.4% | 26.4% |
| Range | 47.2% | 24.4% |
| Mean | 18.1% | 11.9% |
| Median | 15.2% | 11.5% |
| Interquartile 25% (IQ1) | 11.9% | 9.1% |
| Interquartile 75% (IQ3) | 22.3% | 14.2% |
| Interquartile Range (IQR) | 10.4% | 5.1% |
| Standard Deviation (Sample) | 8.6% | 4.4% |
| Standard Deviation (Population) | 8.6% | 4.4% |
Similar Demographics by Seniors Poverty Over the Age of 65
Demographics Similar to Natives/Alaskans by Seniors Poverty Over the Age of 65
In terms of seniors poverty over the age of 65, the demographic groups most similar to Natives/Alaskans are Bahamian (14.2%, a difference of 0.010%), Honduran (14.2%, a difference of 0.27%), Trinidadian and Tobagonian (14.2%, a difference of 0.36%), Immigrants from West Indies (14.2%, a difference of 0.44%), and Hispanic or Latino (14.3%, a difference of 0.54%).
| Demographics | Rating | Rank | Seniors Poverty Over the Age of 65 |
| West Indians | 0.0 /100 | #304 | Tragic 14.1% |
| Immigrants | Trinidad and Tobago | 0.0 /100 | #305 | Tragic 14.1% |
| Immigrants | Latin America | 0.0 /100 | #306 | Tragic 14.2% |
| Immigrants | West Indies | 0.0 /100 | #307 | Tragic 14.2% |
| Trinidadians and Tobagonians | 0.0 /100 | #308 | Tragic 14.2% |
| Hondurans | 0.0 /100 | #309 | Tragic 14.2% |
| Bahamians | 0.0 /100 | #310 | Tragic 14.2% |
| Natives/Alaskans | 0.0 /100 | #311 | Tragic 14.2% |
| Hispanics or Latinos | 0.0 /100 | #312 | Tragic 14.3% |
| Barbadians | 0.0 /100 | #313 | Tragic 14.4% |
| Guyanese | 0.0 /100 | #314 | Tragic 14.4% |
| Immigrants | Ecuador | 0.0 /100 | #315 | Tragic 14.4% |
| Immigrants | Guyana | 0.0 /100 | #316 | Tragic 14.5% |
| Haitians | 0.0 /100 | #317 | Tragic 14.5% |
| Immigrants | Honduras | 0.0 /100 | #318 | Tragic 14.5% |
Demographics Similar to Chickasaw by Seniors Poverty Over the Age of 65
In terms of seniors poverty over the age of 65, the demographic groups most similar to Chickasaw are Ethiopian (10.7%, a difference of 0.070%), Immigrants from Ethiopia (10.7%, a difference of 0.080%), Immigrants from Saudi Arabia (10.7%, a difference of 0.16%), Immigrants from Sierra Leone (10.7%, a difference of 0.22%), and Fijian (10.7%, a difference of 0.24%).
| Demographics | Rating | Rank | Seniors Poverty Over the Age of 65 |
| Americans | 78.1 /100 | #148 | Good 10.6% |
| Immigrants | Cameroon | 78.1 /100 | #149 | Good 10.6% |
| Immigrants | Switzerland | 77.3 /100 | #150 | Good 10.6% |
| Spanish | 76.8 /100 | #151 | Good 10.6% |
| Immigrants | Egypt | 76.5 /100 | #152 | Good 10.6% |
| Fijians | 75.6 /100 | #153 | Good 10.7% |
| Immigrants | Saudi Arabia | 74.9 /100 | #154 | Good 10.7% |
| Chickasaw | 73.6 /100 | #155 | Good 10.7% |
| Ethiopians | 72.9 /100 | #156 | Good 10.7% |
| Immigrants | Ethiopia | 72.9 /100 | #157 | Good 10.7% |
| Immigrants | Sierra Leone | 71.7 /100 | #158 | Good 10.7% |
| Immigrants | Micronesia | 70.8 /100 | #159 | Good 10.7% |
| Sudanese | 68.2 /100 | #160 | Good 10.7% |
| Arabs | 65.2 /100 | #161 | Good 10.8% |
| Immigrants | Indonesia | 64.8 /100 | #162 | Good 10.8% |