Arapaho vs Alaska Native Seniors Poverty Over the Age of 65
COMPARE
Arapaho
Alaska Native
Seniors Poverty Over the Age of 65
Seniors Poverty Over the Age of 65 Comparison
Arapaho
Alaska Natives
11.6%
SENIORS POVERTY OVER THE AGE OF 65
5.2/ 100
METRIC RATING
219th/ 347
METRIC RANK
10.8%
SENIORS POVERTY OVER THE AGE OF 65
60.3/ 100
METRIC RATING
167th/ 347
METRIC RANK
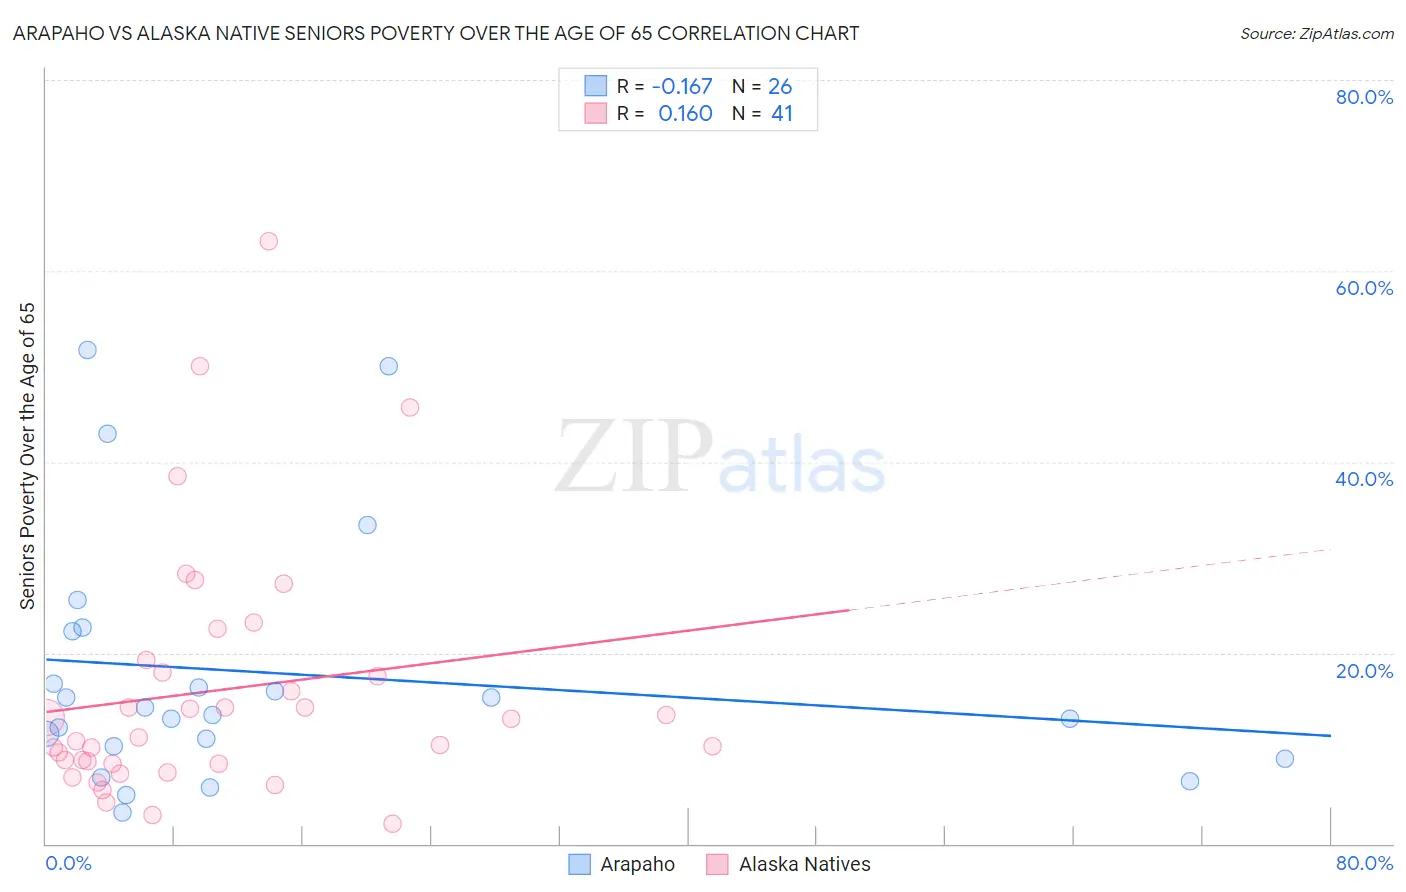
Arapaho vs Alaska Native Seniors Poverty Over the Age of 65 Correlation Chart
The statistical analysis conducted on geographies consisting of 29,765,884 people shows a poor negative correlation between the proportion of Arapaho and poverty level among seniors over the age of 65 in the United States with a correlation coefficient (R) of -0.167 and weighted average of 11.6%. Similarly, the statistical analysis conducted on geographies consisting of 76,614,353 people shows a poor positive correlation between the proportion of Alaska Natives and poverty level among seniors over the age of 65 in the United States with a correlation coefficient (R) of 0.160 and weighted average of 10.8%, a difference of 7.4%.
Seniors Poverty Over the Age of 65 Correlation Summary
| Measurement | Arapaho | Alaska Native |
| Minimum | 3.2% | 2.0% |
| Maximum | 51.7% | 63.2% |
| Range | 48.5% | 61.1% |
| Mean | 17.8% | 16.1% |
| Median | 13.9% | 11.1% |
| Interquartile 25% (IQ1) | 10.2% | 8.4% |
| Interquartile 75% (IQ3) | 22.2% | 18.6% |
| Interquartile Range (IQR) | 12.0% | 10.2% |
| Standard Deviation (Sample) | 13.1% | 13.1% |
| Standard Deviation (Population) | 12.8% | 12.9% |
Similar Demographics by Seniors Poverty Over the Age of 65
Demographics Similar to Arapaho by Seniors Poverty Over the Age of 65
In terms of seniors poverty over the age of 65, the demographic groups most similar to Arapaho are Immigrants from Ukraine (11.6%, a difference of 0.18%), Immigrants from Africa (11.6%, a difference of 0.45%), Peruvian (11.7%, a difference of 0.48%), Argentinean (11.7%, a difference of 0.55%), and Immigrants from Morocco (11.6%, a difference of 0.59%).
| Demographics | Rating | Rank | Seniors Poverty Over the Age of 65 |
| Immigrants | China | 9.5 /100 | #212 | Tragic 11.5% |
| Nepalese | 8.9 /100 | #213 | Tragic 11.5% |
| Immigrants | Russia | 8.8 /100 | #214 | Tragic 11.5% |
| French American Indians | 8.7 /100 | #215 | Tragic 11.5% |
| Immigrants | Morocco | 6.8 /100 | #216 | Tragic 11.6% |
| Immigrants | Africa | 6.4 /100 | #217 | Tragic 11.6% |
| Immigrants | Ukraine | 5.7 /100 | #218 | Tragic 11.6% |
| Arapaho | 5.2 /100 | #219 | Tragic 11.6% |
| Peruvians | 4.2 /100 | #220 | Tragic 11.7% |
| Argentineans | 4.1 /100 | #221 | Tragic 11.7% |
| Immigrants | Chile | 3.9 /100 | #222 | Tragic 11.7% |
| Immigrants | Congo | 3.8 /100 | #223 | Tragic 11.7% |
| Immigrants | Nigeria | 3.4 /100 | #224 | Tragic 11.7% |
| Immigrants | Belarus | 3.2 /100 | #225 | Tragic 11.8% |
| Liberians | 3.2 /100 | #226 | Tragic 11.8% |
Demographics Similar to Alaska Natives by Seniors Poverty Over the Age of 65
In terms of seniors poverty over the age of 65, the demographic groups most similar to Alaska Natives are Malaysian (10.8%, a difference of 0.16%), Immigrants from South Eastern Asia (10.8%, a difference of 0.17%), Potawatomi (10.8%, a difference of 0.22%), Mongolian (10.9%, a difference of 0.22%), and Sri Lankan (10.9%, a difference of 0.32%).
| Demographics | Rating | Rank | Seniors Poverty Over the Age of 65 |
| Sudanese | 68.2 /100 | #160 | Good 10.7% |
| Arabs | 65.2 /100 | #161 | Good 10.8% |
| Immigrants | Indonesia | 64.8 /100 | #162 | Good 10.8% |
| Tsimshian | 64.5 /100 | #163 | Good 10.8% |
| Potawatomi | 62.6 /100 | #164 | Good 10.8% |
| Immigrants | South Eastern Asia | 62.1 /100 | #165 | Good 10.8% |
| Malaysians | 62.0 /100 | #166 | Good 10.8% |
| Alaska Natives | 60.3 /100 | #167 | Good 10.8% |
| Mongolians | 58.0 /100 | #168 | Average 10.9% |
| Sri Lankans | 56.8 /100 | #169 | Average 10.9% |
| Immigrants | Eastern Europe | 55.8 /100 | #170 | Average 10.9% |
| Immigrants | Nonimmigrants | 55.1 /100 | #171 | Average 10.9% |
| Immigrants | Syria | 54.7 /100 | #172 | Average 10.9% |
| Spaniards | 50.7 /100 | #173 | Average 10.9% |
| Immigrants | Sudan | 50.0 /100 | #174 | Average 10.9% |