Arab vs Immigrants from Yemen Child Poverty Among Girls Under 16
COMPARE
Arab
Immigrants from Yemen
Child Poverty Among Girls Under 16
Child Poverty Among Girls Under 16 Comparison
Arabs
Immigrants from Yemen
16.8%
CHILD POVERTY AMONG GIRLS UNDER 16
34.5/ 100
METRIC RATING
188th/ 347
METRIC RANK
29.5%
CHILD POVERTY AMONG GIRLS UNDER 16
0.0/ 100
METRIC RATING
343rd/ 347
METRIC RANK
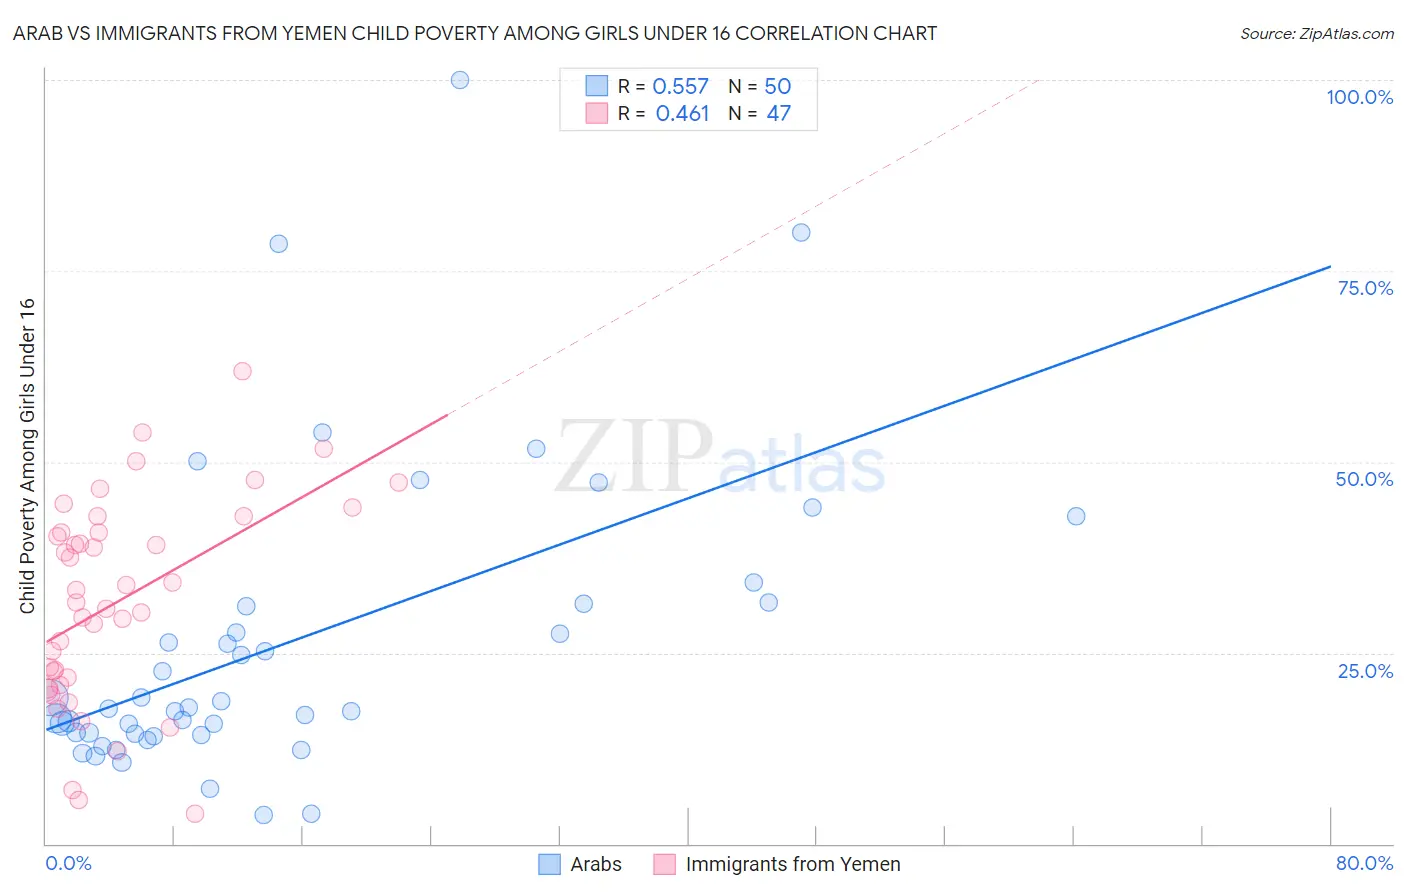
Arab vs Immigrants from Yemen Child Poverty Among Girls Under 16 Correlation Chart
The statistical analysis conducted on geographies consisting of 474,430,772 people shows a substantial positive correlation between the proportion of Arabs and poverty level among girls under the age of 16 in the United States with a correlation coefficient (R) of 0.557 and weighted average of 16.8%. Similarly, the statistical analysis conducted on geographies consisting of 82,295,709 people shows a moderate positive correlation between the proportion of Immigrants from Yemen and poverty level among girls under the age of 16 in the United States with a correlation coefficient (R) of 0.461 and weighted average of 29.5%, a difference of 75.8%.
Child Poverty Among Girls Under 16 Correlation Summary
| Measurement | Arab | Immigrants from Yemen |
| Minimum | 3.7% | 3.9% |
| Maximum | 100.0% | 61.8% |
| Range | 96.3% | 57.9% |
| Mean | 26.3% | 31.7% |
| Median | 17.8% | 31.7% |
| Interquartile 25% (IQ1) | 14.5% | 20.8% |
| Interquartile 75% (IQ3) | 31.4% | 40.8% |
| Interquartile Range (IQR) | 17.0% | 20.0% |
| Standard Deviation (Sample) | 19.9% | 13.4% |
| Standard Deviation (Population) | 19.7% | 13.2% |
Similar Demographics by Child Poverty Among Girls Under 16
Demographics Similar to Arabs by Child Poverty Among Girls Under 16
In terms of child poverty among girls under 16, the demographic groups most similar to Arabs are Immigrants from Morocco (16.8%, a difference of 0.010%), South American Indian (16.8%, a difference of 0.060%), Immigrants from Uruguay (16.7%, a difference of 0.13%), Immigrants from Bosnia and Herzegovina (16.8%, a difference of 0.25%), and Kenyan (16.8%, a difference of 0.29%).
| Demographics | Rating | Rank | Child Poverty Among Girls Under 16 |
| Immigrants | Iraq | 43.2 /100 | #181 | Average 16.6% |
| Immigrants | Ethiopia | 43.1 /100 | #182 | Average 16.6% |
| Immigrants | Portugal | 42.5 /100 | #183 | Average 16.6% |
| Scotch-Irish | 39.6 /100 | #184 | Fair 16.7% |
| Immigrants | Uruguay | 35.6 /100 | #185 | Fair 16.7% |
| South American Indians | 35.0 /100 | #186 | Fair 16.8% |
| Immigrants | Morocco | 34.6 /100 | #187 | Fair 16.8% |
| Arabs | 34.5 /100 | #188 | Fair 16.8% |
| Immigrants | Bosnia and Herzegovina | 32.5 /100 | #189 | Fair 16.8% |
| Kenyans | 32.3 /100 | #190 | Fair 16.8% |
| Immigrants | Azores | 31.3 /100 | #191 | Fair 16.8% |
| Immigrants | Uganda | 31.3 /100 | #192 | Fair 16.8% |
| Aleuts | 28.7 /100 | #193 | Fair 16.9% |
| Spanish | 28.6 /100 | #194 | Fair 16.9% |
| Immigrants | Costa Rica | 25.6 /100 | #195 | Fair 17.0% |
Demographics Similar to Immigrants from Yemen by Child Poverty Among Girls Under 16
In terms of child poverty among girls under 16, the demographic groups most similar to Immigrants from Yemen are Navajo (30.5%, a difference of 3.3%), Lumbee (30.7%, a difference of 4.1%), Pima (28.2%, a difference of 4.5%), Hopi (27.9%, a difference of 5.9%), and Tohono O'odham (31.6%, a difference of 7.2%).
| Demographics | Rating | Rank | Child Poverty Among Girls Under 16 |
| Blacks/African Americans | 0.0 /100 | #333 | Tragic 24.7% |
| Menominee | 0.0 /100 | #334 | Tragic 25.0% |
| Pueblo | 0.0 /100 | #335 | Tragic 25.2% |
| Sioux | 0.0 /100 | #336 | Tragic 25.6% |
| Yup'ik | 0.0 /100 | #337 | Tragic 25.8% |
| Cheyenne | 0.0 /100 | #338 | Tragic 26.3% |
| Crow | 0.0 /100 | #339 | Tragic 26.4% |
| Yuman | 0.0 /100 | #340 | Tragic 27.1% |
| Hopi | 0.0 /100 | #341 | Tragic 27.9% |
| Pima | 0.0 /100 | #342 | Tragic 28.2% |
| Immigrants | Yemen | 0.0 /100 | #343 | Tragic 29.5% |
| Navajo | 0.0 /100 | #344 | Tragic 30.5% |
| Lumbee | 0.0 /100 | #345 | Tragic 30.7% |
| Tohono O'odham | 0.0 /100 | #346 | Tragic 31.6% |
| Puerto Ricans | 0.0 /100 | #347 | Tragic 32.7% |