Arab vs Apache Child Poverty Among Girls Under 16
COMPARE
Arab
Apache
Child Poverty Among Girls Under 16
Child Poverty Among Girls Under 16 Comparison
Arabs
Apache
16.8%
CHILD POVERTY AMONG GIRLS UNDER 16
34.5/ 100
METRIC RATING
188th/ 347
METRIC RANK
23.8%
CHILD POVERTY AMONG GIRLS UNDER 16
0.0/ 100
METRIC RATING
331st/ 347
METRIC RANK
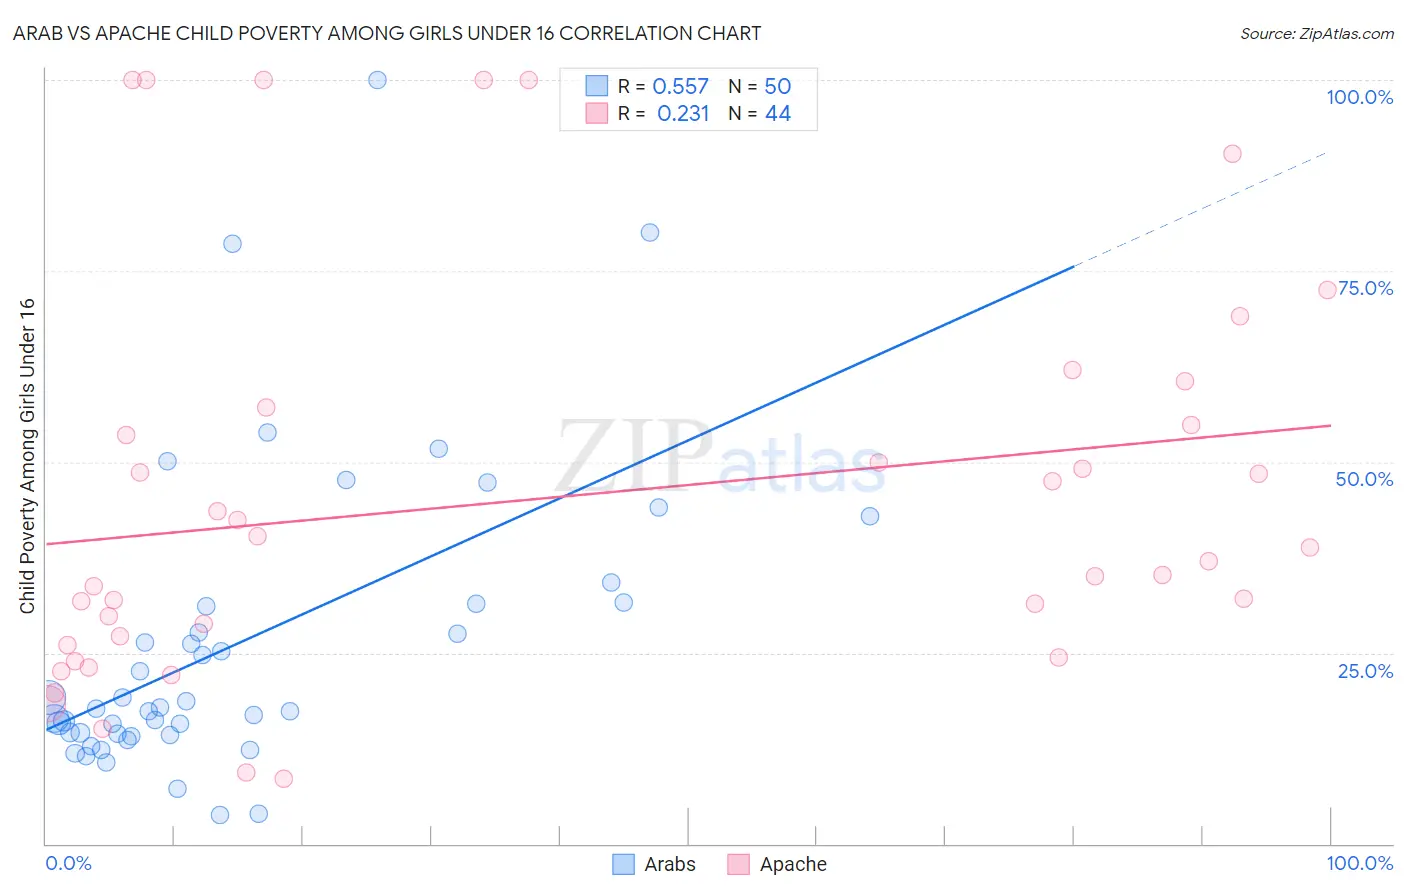
Arab vs Apache Child Poverty Among Girls Under 16 Correlation Chart
The statistical analysis conducted on geographies consisting of 474,430,772 people shows a substantial positive correlation between the proportion of Arabs and poverty level among girls under the age of 16 in the United States with a correlation coefficient (R) of 0.557 and weighted average of 16.8%. Similarly, the statistical analysis conducted on geographies consisting of 229,644,906 people shows a weak positive correlation between the proportion of Apache and poverty level among girls under the age of 16 in the United States with a correlation coefficient (R) of 0.231 and weighted average of 23.8%, a difference of 42.1%.
Child Poverty Among Girls Under 16 Correlation Summary
| Measurement | Arab | Apache |
| Minimum | 3.7% | 8.5% |
| Maximum | 100.0% | 100.0% |
| Range | 96.3% | 91.5% |
| Mean | 26.3% | 45.4% |
| Median | 17.8% | 37.9% |
| Interquartile 25% (IQ1) | 14.5% | 26.6% |
| Interquartile 75% (IQ3) | 31.4% | 56.0% |
| Interquartile Range (IQR) | 17.0% | 29.4% |
| Standard Deviation (Sample) | 19.9% | 26.0% |
| Standard Deviation (Population) | 19.7% | 25.7% |
Similar Demographics by Child Poverty Among Girls Under 16
Demographics Similar to Arabs by Child Poverty Among Girls Under 16
In terms of child poverty among girls under 16, the demographic groups most similar to Arabs are Immigrants from Morocco (16.8%, a difference of 0.010%), South American Indian (16.8%, a difference of 0.060%), Immigrants from Uruguay (16.7%, a difference of 0.13%), Immigrants from Bosnia and Herzegovina (16.8%, a difference of 0.25%), and Kenyan (16.8%, a difference of 0.29%).
| Demographics | Rating | Rank | Child Poverty Among Girls Under 16 |
| Immigrants | Iraq | 43.2 /100 | #181 | Average 16.6% |
| Immigrants | Ethiopia | 43.1 /100 | #182 | Average 16.6% |
| Immigrants | Portugal | 42.5 /100 | #183 | Average 16.6% |
| Scotch-Irish | 39.6 /100 | #184 | Fair 16.7% |
| Immigrants | Uruguay | 35.6 /100 | #185 | Fair 16.7% |
| South American Indians | 35.0 /100 | #186 | Fair 16.8% |
| Immigrants | Morocco | 34.6 /100 | #187 | Fair 16.8% |
| Arabs | 34.5 /100 | #188 | Fair 16.8% |
| Immigrants | Bosnia and Herzegovina | 32.5 /100 | #189 | Fair 16.8% |
| Kenyans | 32.3 /100 | #190 | Fair 16.8% |
| Immigrants | Azores | 31.3 /100 | #191 | Fair 16.8% |
| Immigrants | Uganda | 31.3 /100 | #192 | Fair 16.8% |
| Aleuts | 28.7 /100 | #193 | Fair 16.9% |
| Spanish | 28.6 /100 | #194 | Fair 16.9% |
| Immigrants | Costa Rica | 25.6 /100 | #195 | Fair 17.0% |
Demographics Similar to Apache by Child Poverty Among Girls Under 16
In terms of child poverty among girls under 16, the demographic groups most similar to Apache are Immigrants from Dominican Republic (23.8%, a difference of 0.050%), Kiowa (23.7%, a difference of 0.58%), Dominican (23.7%, a difference of 0.70%), Native/Alaskan (24.0%, a difference of 0.86%), and Black/African American (24.7%, a difference of 3.4%).
| Demographics | Rating | Rank | Child Poverty Among Girls Under 16 |
| Paiute | 0.0 /100 | #324 | Tragic 22.6% |
| Immigrants | Congo | 0.0 /100 | #325 | Tragic 22.7% |
| Immigrants | Honduras | 0.0 /100 | #326 | Tragic 22.8% |
| Central American Indians | 0.0 /100 | #327 | Tragic 22.8% |
| Dominicans | 0.0 /100 | #328 | Tragic 23.7% |
| Kiowa | 0.0 /100 | #329 | Tragic 23.7% |
| Immigrants | Dominican Republic | 0.0 /100 | #330 | Tragic 23.8% |
| Apache | 0.0 /100 | #331 | Tragic 23.8% |
| Natives/Alaskans | 0.0 /100 | #332 | Tragic 24.0% |
| Blacks/African Americans | 0.0 /100 | #333 | Tragic 24.7% |
| Menominee | 0.0 /100 | #334 | Tragic 25.0% |
| Pueblo | 0.0 /100 | #335 | Tragic 25.2% |
| Sioux | 0.0 /100 | #336 | Tragic 25.6% |
| Yup'ik | 0.0 /100 | #337 | Tragic 25.8% |
| Cheyenne | 0.0 /100 | #338 | Tragic 26.3% |