Arab vs Argentinean Child Poverty Among Girls Under 16
COMPARE
Arab
Argentinean
Child Poverty Among Girls Under 16
Child Poverty Among Girls Under 16 Comparison
Arabs
Argentineans
16.8%
CHILD POVERTY AMONG GIRLS UNDER 16
34.5/ 100
METRIC RATING
188th/ 347
METRIC RANK
14.7%
CHILD POVERTY AMONG GIRLS UNDER 16
97.9/ 100
METRIC RATING
78th/ 347
METRIC RANK
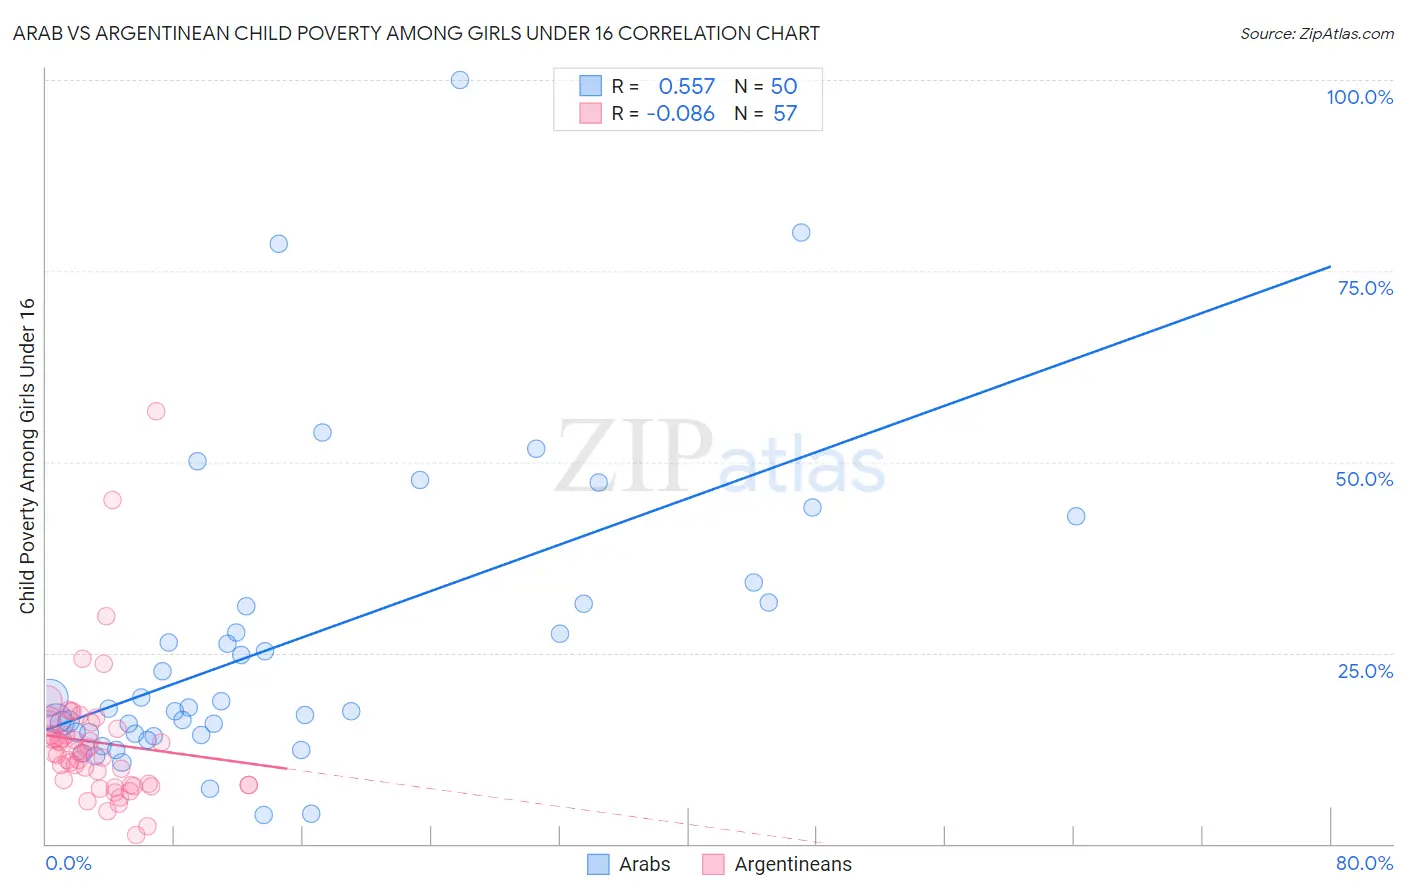
Arab vs Argentinean Child Poverty Among Girls Under 16 Correlation Chart
The statistical analysis conducted on geographies consisting of 474,430,772 people shows a substantial positive correlation between the proportion of Arabs and poverty level among girls under the age of 16 in the United States with a correlation coefficient (R) of 0.557 and weighted average of 16.8%. Similarly, the statistical analysis conducted on geographies consisting of 293,059,037 people shows a slight negative correlation between the proportion of Argentineans and poverty level among girls under the age of 16 in the United States with a correlation coefficient (R) of -0.086 and weighted average of 14.7%, a difference of 14.4%.
Child Poverty Among Girls Under 16 Correlation Summary
| Measurement | Arab | Argentinean |
| Minimum | 3.7% | 1.1% |
| Maximum | 100.0% | 56.7% |
| Range | 96.3% | 55.6% |
| Mean | 26.3% | 13.3% |
| Median | 17.8% | 11.9% |
| Interquartile 25% (IQ1) | 14.5% | 7.7% |
| Interquartile 75% (IQ3) | 31.4% | 15.4% |
| Interquartile Range (IQR) | 17.0% | 7.7% |
| Standard Deviation (Sample) | 19.9% | 9.0% |
| Standard Deviation (Population) | 19.7% | 8.9% |
Similar Demographics by Child Poverty Among Girls Under 16
Demographics Similar to Arabs by Child Poverty Among Girls Under 16
In terms of child poverty among girls under 16, the demographic groups most similar to Arabs are Immigrants from Morocco (16.8%, a difference of 0.010%), South American Indian (16.8%, a difference of 0.060%), Immigrants from Uruguay (16.7%, a difference of 0.13%), Immigrants from Bosnia and Herzegovina (16.8%, a difference of 0.25%), and Kenyan (16.8%, a difference of 0.29%).
| Demographics | Rating | Rank | Child Poverty Among Girls Under 16 |
| Immigrants | Iraq | 43.2 /100 | #181 | Average 16.6% |
| Immigrants | Ethiopia | 43.1 /100 | #182 | Average 16.6% |
| Immigrants | Portugal | 42.5 /100 | #183 | Average 16.6% |
| Scotch-Irish | 39.6 /100 | #184 | Fair 16.7% |
| Immigrants | Uruguay | 35.6 /100 | #185 | Fair 16.7% |
| South American Indians | 35.0 /100 | #186 | Fair 16.8% |
| Immigrants | Morocco | 34.6 /100 | #187 | Fair 16.8% |
| Arabs | 34.5 /100 | #188 | Fair 16.8% |
| Immigrants | Bosnia and Herzegovina | 32.5 /100 | #189 | Fair 16.8% |
| Kenyans | 32.3 /100 | #190 | Fair 16.8% |
| Immigrants | Azores | 31.3 /100 | #191 | Fair 16.8% |
| Immigrants | Uganda | 31.3 /100 | #192 | Fair 16.8% |
| Aleuts | 28.7 /100 | #193 | Fair 16.9% |
| Spanish | 28.6 /100 | #194 | Fair 16.9% |
| Immigrants | Costa Rica | 25.6 /100 | #195 | Fair 17.0% |
Demographics Similar to Argentineans by Child Poverty Among Girls Under 16
In terms of child poverty among girls under 16, the demographic groups most similar to Argentineans are Tlingit-Haida (14.7%, a difference of 0.010%), Immigrants from Russia (14.7%, a difference of 0.020%), Immigrants from Turkey (14.7%, a difference of 0.020%), Egyptian (14.7%, a difference of 0.020%), and Immigrants from Eastern Europe (14.6%, a difference of 0.16%).
| Demographics | Rating | Rank | Child Poverty Among Girls Under 16 |
| Slovenes | 98.1 /100 | #71 | Exceptional 14.6% |
| Immigrants | Netherlands | 98.1 /100 | #72 | Exceptional 14.6% |
| Immigrants | Austria | 98.0 /100 | #73 | Exceptional 14.6% |
| Taiwanese | 98.0 /100 | #74 | Exceptional 14.6% |
| Immigrants | Eastern Europe | 98.0 /100 | #75 | Exceptional 14.6% |
| Immigrants | Russia | 97.9 /100 | #76 | Exceptional 14.7% |
| Tlingit-Haida | 97.9 /100 | #77 | Exceptional 14.7% |
| Argentineans | 97.9 /100 | #78 | Exceptional 14.7% |
| Immigrants | Turkey | 97.9 /100 | #79 | Exceptional 14.7% |
| Egyptians | 97.9 /100 | #80 | Exceptional 14.7% |
| Ukrainians | 97.7 /100 | #81 | Exceptional 14.7% |
| Macedonians | 97.6 /100 | #82 | Exceptional 14.7% |
| Immigrants | Italy | 97.4 /100 | #83 | Exceptional 14.8% |
| Soviet Union | 97.3 /100 | #84 | Exceptional 14.8% |
| Swiss | 97.2 /100 | #85 | Exceptional 14.8% |