Arab vs Immigrants from Yemen Hearing Disability
COMPARE
Arab
Immigrants from Yemen
Hearing Disability
Hearing Disability Comparison
Arabs
Immigrants from Yemen
3.0%
HEARING DISABILITY
57.6/ 100
METRIC RATING
169th/ 347
METRIC RANK
2.8%
HEARING DISABILITY
92.7/ 100
METRIC RATING
111th/ 347
METRIC RANK
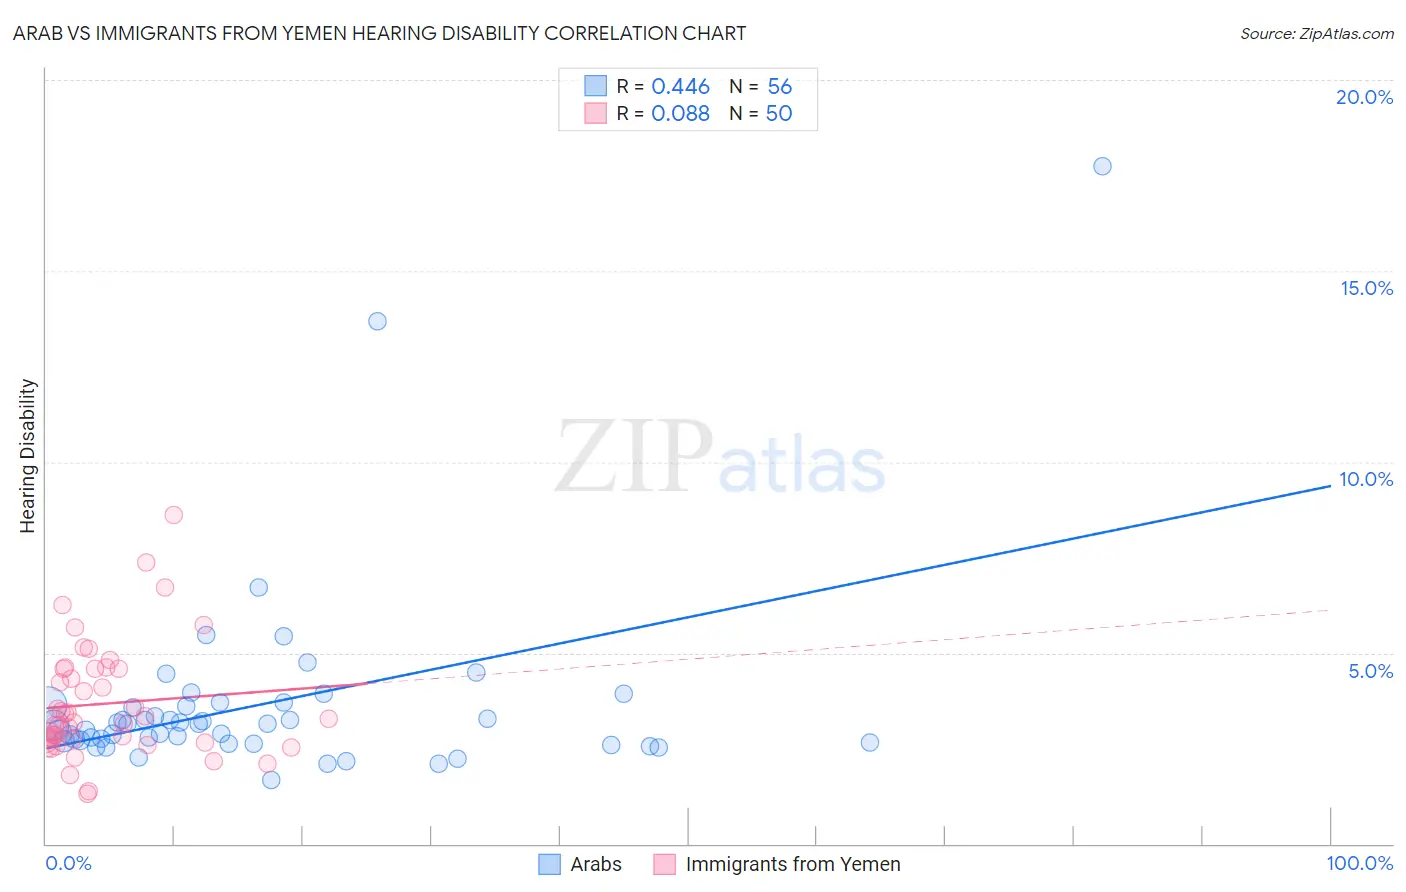
Arab vs Immigrants from Yemen Hearing Disability Correlation Chart
The statistical analysis conducted on geographies consisting of 486,579,834 people shows a moderate positive correlation between the proportion of Arabs and percentage of population with hearing disability in the United States with a correlation coefficient (R) of 0.446 and weighted average of 3.0%. Similarly, the statistical analysis conducted on geographies consisting of 82,433,214 people shows a slight positive correlation between the proportion of Immigrants from Yemen and percentage of population with hearing disability in the United States with a correlation coefficient (R) of 0.088 and weighted average of 2.8%, a difference of 5.6%.
Hearing Disability Correlation Summary
| Measurement | Arab | Immigrants from Yemen |
| Minimum | 1.7% | 1.3% |
| Maximum | 17.8% | 8.6% |
| Range | 16.1% | 7.3% |
| Mean | 3.6% | 3.7% |
| Median | 3.1% | 3.2% |
| Interquartile 25% (IQ1) | 2.7% | 2.7% |
| Interquartile 75% (IQ3) | 3.6% | 4.6% |
| Interquartile Range (IQR) | 0.96% | 1.9% |
| Standard Deviation (Sample) | 2.5% | 1.5% |
| Standard Deviation (Population) | 2.5% | 1.5% |
Similar Demographics by Hearing Disability
Demographics Similar to Arabs by Hearing Disability
In terms of hearing disability, the demographic groups most similar to Arabs are Immigrants from Greece (3.0%, a difference of 0.030%), Immigrants from Eastern Europe (3.0%, a difference of 0.040%), Immigrants from Cabo Verde (3.0%, a difference of 0.070%), Immigrants from Ukraine (3.0%, a difference of 0.10%), and Armenian (3.0%, a difference of 0.15%).
| Demographics | Rating | Rank | Hearing Disability |
| Immigrants | Japan | 66.3 /100 | #162 | Good 2.9% |
| Immigrants | Central America | 64.9 /100 | #163 | Good 3.0% |
| Immigrants | Cambodia | 64.8 /100 | #164 | Good 3.0% |
| Immigrants | Zimbabwe | 64.2 /100 | #165 | Good 3.0% |
| Immigrants | South Eastern Asia | 62.9 /100 | #166 | Good 3.0% |
| Immigrants | Eastern Europe | 58.1 /100 | #167 | Average 3.0% |
| Immigrants | Greece | 57.9 /100 | #168 | Average 3.0% |
| Arabs | 57.6 /100 | #169 | Average 3.0% |
| Immigrants | Cabo Verde | 56.9 /100 | #170 | Average 3.0% |
| Immigrants | Ukraine | 56.6 /100 | #171 | Average 3.0% |
| Armenians | 56.0 /100 | #172 | Average 3.0% |
| Immigrants | Serbia | 51.1 /100 | #173 | Average 3.0% |
| Indonesians | 50.0 /100 | #174 | Average 3.0% |
| Immigrants | Romania | 48.4 /100 | #175 | Average 3.0% |
| Panamanians | 47.0 /100 | #176 | Average 3.0% |
Demographics Similar to Immigrants from Yemen by Hearing Disability
In terms of hearing disability, the demographic groups most similar to Immigrants from Yemen are Cypriot (2.8%, a difference of 0.050%), U.S. Virgin Islander (2.8%, a difference of 0.070%), Turkish (2.8%, a difference of 0.10%), Guatemalan (2.8%, a difference of 0.17%), and Honduran (2.8%, a difference of 0.25%).
| Demographics | Rating | Rank | Hearing Disability |
| Burmese | 94.2 /100 | #104 | Exceptional 2.8% |
| Moroccans | 93.9 /100 | #105 | Exceptional 2.8% |
| Hondurans | 93.4 /100 | #106 | Exceptional 2.8% |
| Immigrants | Chile | 93.4 /100 | #107 | Exceptional 2.8% |
| Guatemalans | 93.2 /100 | #108 | Exceptional 2.8% |
| Turks | 93.0 /100 | #109 | Exceptional 2.8% |
| Cypriots | 92.9 /100 | #110 | Exceptional 2.8% |
| Immigrants | Yemen | 92.7 /100 | #111 | Exceptional 2.8% |
| U.S. Virgin Islanders | 92.5 /100 | #112 | Exceptional 2.8% |
| Immigrants | Belarus | 91.6 /100 | #113 | Exceptional 2.8% |
| Cambodians | 91.1 /100 | #114 | Exceptional 2.8% |
| Immigrants | Latin America | 90.5 /100 | #115 | Exceptional 2.8% |
| Immigrants | Immigrants | 90.3 /100 | #116 | Exceptional 2.8% |
| Immigrants | Liberia | 90.0 /100 | #117 | Excellent 2.8% |
| Zimbabweans | 89.9 /100 | #118 | Excellent 2.8% |