Apache vs Irish Poverty
COMPARE
Apache
Irish
Poverty
Poverty Comparison
Apache
Irish
18.4%
POVERTY
0.0/ 100
METRIC RATING
334th/ 347
METRIC RANK
11.3%
POVERTY
96.6/ 100
METRIC RATING
81st/ 347
METRIC RANK
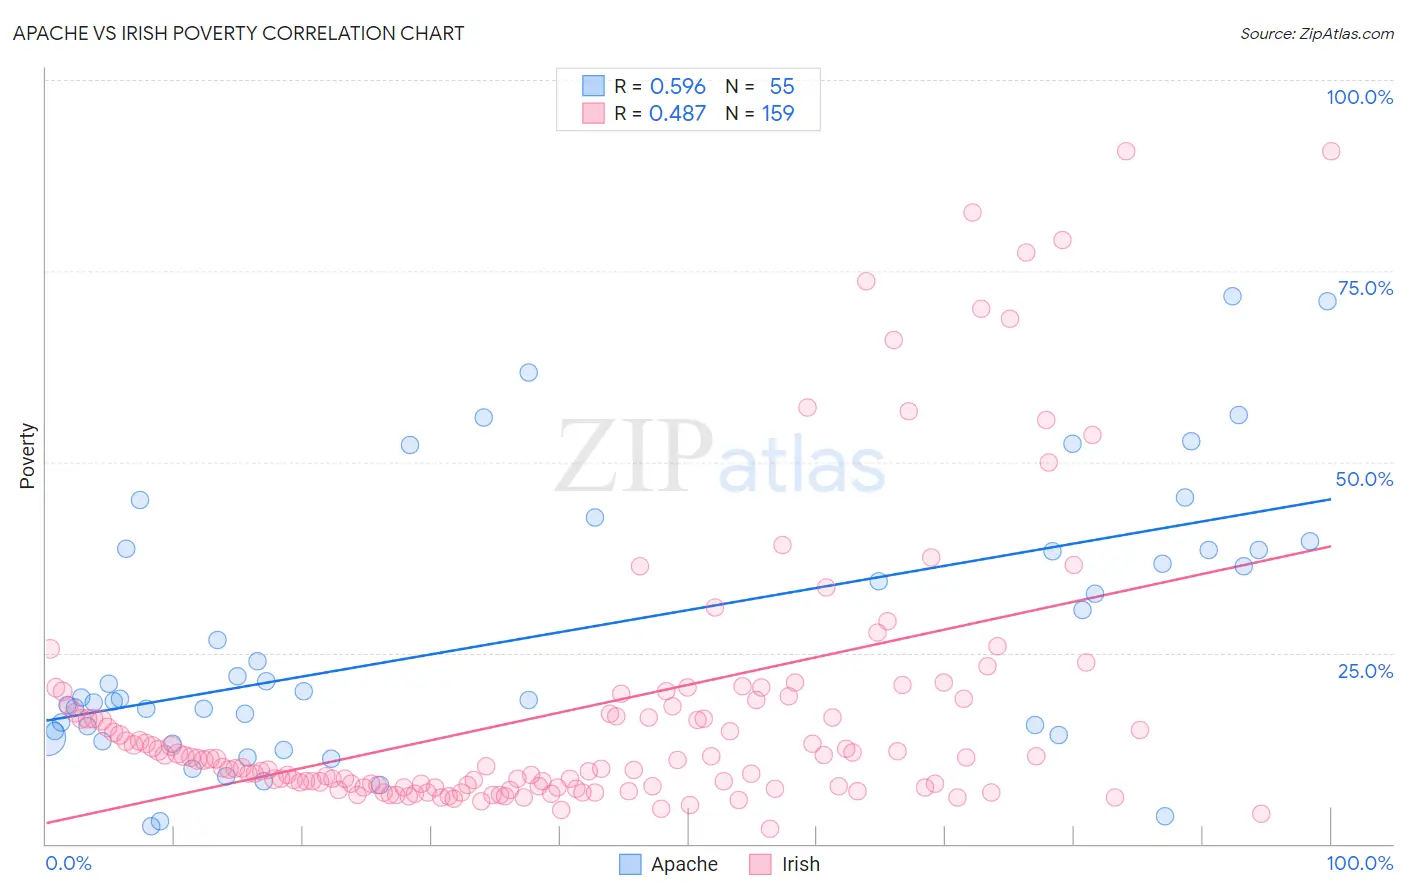
Apache vs Irish Poverty Correlation Chart
The statistical analysis conducted on geographies consisting of 231,028,854 people shows a substantial positive correlation between the proportion of Apache and poverty level in the United States with a correlation coefficient (R) of 0.596 and weighted average of 18.4%. Similarly, the statistical analysis conducted on geographies consisting of 579,456,030 people shows a moderate positive correlation between the proportion of Irish and poverty level in the United States with a correlation coefficient (R) of 0.487 and weighted average of 11.3%, a difference of 62.8%.
Poverty Correlation Summary
| Measurement | Apache | Irish |
| Minimum | 2.2% | 2.0% |
| Maximum | 71.7% | 90.7% |
| Range | 69.5% | 88.7% |
| Mean | 26.9% | 17.4% |
| Median | 19.1% | 11.0% |
| Interquartile 25% (IQ1) | 14.2% | 7.5% |
| Interquartile 75% (IQ3) | 38.5% | 18.1% |
| Interquartile Range (IQR) | 24.4% | 10.6% |
| Standard Deviation (Sample) | 17.5% | 18.1% |
| Standard Deviation (Population) | 17.4% | 18.0% |
Similar Demographics by Poverty
Demographics Similar to Apache by Poverty
In terms of poverty, the demographic groups most similar to Apache are Houma (18.4%, a difference of 0.0%), Native/Alaskan (18.1%, a difference of 2.0%), Cheyenne (18.9%, a difference of 2.8%), Immigrants from Dominican Republic (17.8%, a difference of 3.5%), and Dominican (17.6%, a difference of 4.4%).
| Demographics | Rating | Rank | Poverty |
| Kiowa | 0.0 /100 | #327 | Tragic 16.8% |
| Ute | 0.0 /100 | #328 | Tragic 16.9% |
| Blacks/African Americans | 0.0 /100 | #329 | Tragic 17.3% |
| Dominicans | 0.0 /100 | #330 | Tragic 17.6% |
| Immigrants | Dominican Republic | 0.0 /100 | #331 | Tragic 17.8% |
| Natives/Alaskans | 0.0 /100 | #332 | Tragic 18.1% |
| Houma | 0.0 /100 | #333 | Tragic 18.4% |
| Apache | 0.0 /100 | #334 | Tragic 18.4% |
| Cheyenne | 0.0 /100 | #335 | Tragic 18.9% |
| Pueblo | 0.0 /100 | #336 | Tragic 19.4% |
| Sioux | 0.0 /100 | #337 | Tragic 19.8% |
| Yuman | 0.0 /100 | #338 | Tragic 20.2% |
| Crow | 0.0 /100 | #339 | Tragic 20.7% |
| Yup'ik | 0.0 /100 | #340 | Tragic 20.8% |
| Hopi | 0.0 /100 | #341 | Tragic 20.8% |
Demographics Similar to Irish by Poverty
In terms of poverty, the demographic groups most similar to Irish are Indian (Asian) (11.3%, a difference of 0.0%), Cambodian (11.3%, a difference of 0.020%), Dutch (11.3%, a difference of 0.070%), Immigrants from Eastern Asia (11.3%, a difference of 0.080%), and Egyptian (11.3%, a difference of 0.090%).
| Demographics | Rating | Rank | Poverty |
| Carpatho Rusyns | 97.2 /100 | #74 | Exceptional 11.3% |
| Immigrants | Eastern Europe | 97.0 /100 | #75 | Exceptional 11.3% |
| Immigrants | North America | 96.8 /100 | #76 | Exceptional 11.3% |
| Immigrants | Eastern Asia | 96.7 /100 | #77 | Exceptional 11.3% |
| Dutch | 96.7 /100 | #78 | Exceptional 11.3% |
| Cambodians | 96.7 /100 | #79 | Exceptional 11.3% |
| Indians (Asian) | 96.6 /100 | #80 | Exceptional 11.3% |
| Irish | 96.6 /100 | #81 | Exceptional 11.3% |
| Egyptians | 96.5 /100 | #82 | Exceptional 11.3% |
| Immigrants | Sweden | 96.3 /100 | #83 | Exceptional 11.3% |
| English | 96.3 /100 | #84 | Exceptional 11.3% |
| Immigrants | England | 96.2 /100 | #85 | Exceptional 11.4% |
| Jordanians | 96.0 /100 | #86 | Exceptional 11.4% |
| Northern Europeans | 96.0 /100 | #87 | Exceptional 11.4% |
| Belgians | 95.8 /100 | #88 | Exceptional 11.4% |