Apache vs Immigrants from Israel Poverty
COMPARE
Apache
Immigrants from Israel
Poverty
Poverty Comparison
Apache
Immigrants from Israel
18.4%
POVERTY
0.0/ 100
METRIC RATING
334th/ 347
METRIC RANK
11.7%
POVERTY
87.4/ 100
METRIC RATING
128th/ 347
METRIC RANK
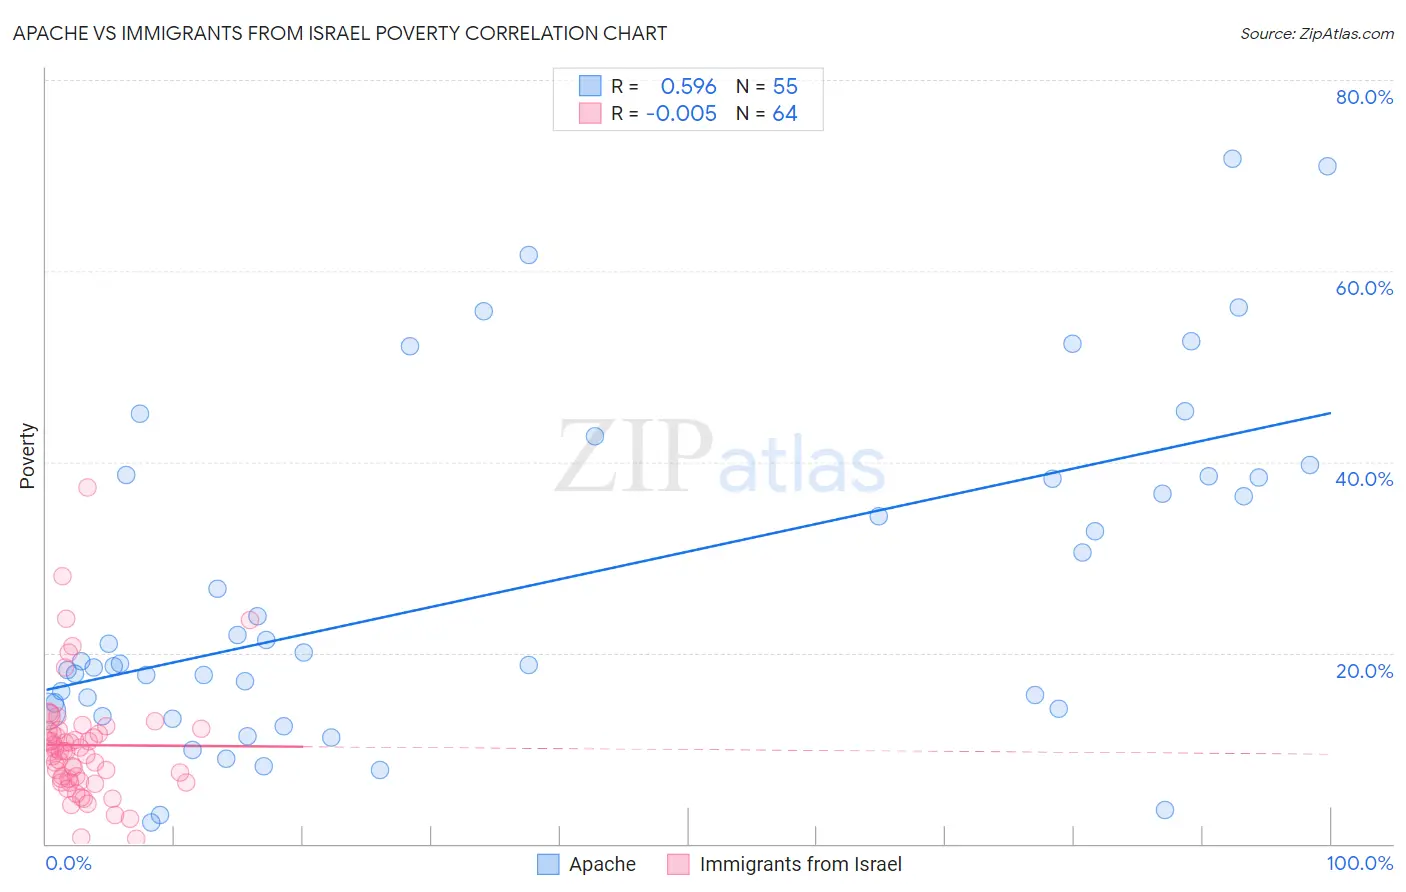
Apache vs Immigrants from Israel Poverty Correlation Chart
The statistical analysis conducted on geographies consisting of 231,028,854 people shows a substantial positive correlation between the proportion of Apache and poverty level in the United States with a correlation coefficient (R) of 0.596 and weighted average of 18.4%. Similarly, the statistical analysis conducted on geographies consisting of 209,974,563 people shows no correlation between the proportion of Immigrants from Israel and poverty level in the United States with a correlation coefficient (R) of -0.005 and weighted average of 11.7%, a difference of 56.9%.
Poverty Correlation Summary
| Measurement | Apache | Immigrants from Israel |
| Minimum | 2.2% | 0.47% |
| Maximum | 71.7% | 37.3% |
| Range | 69.5% | 36.8% |
| Mean | 26.9% | 10.3% |
| Median | 19.1% | 9.7% |
| Interquartile 25% (IQ1) | 14.2% | 6.6% |
| Interquartile 75% (IQ3) | 38.5% | 11.9% |
| Interquartile Range (IQR) | 24.4% | 5.2% |
| Standard Deviation (Sample) | 17.5% | 6.2% |
| Standard Deviation (Population) | 17.4% | 6.1% |
Similar Demographics by Poverty
Demographics Similar to Apache by Poverty
In terms of poverty, the demographic groups most similar to Apache are Houma (18.4%, a difference of 0.0%), Native/Alaskan (18.1%, a difference of 2.0%), Cheyenne (18.9%, a difference of 2.8%), Immigrants from Dominican Republic (17.8%, a difference of 3.5%), and Dominican (17.6%, a difference of 4.4%).
| Demographics | Rating | Rank | Poverty |
| Kiowa | 0.0 /100 | #327 | Tragic 16.8% |
| Ute | 0.0 /100 | #328 | Tragic 16.9% |
| Blacks/African Americans | 0.0 /100 | #329 | Tragic 17.3% |
| Dominicans | 0.0 /100 | #330 | Tragic 17.6% |
| Immigrants | Dominican Republic | 0.0 /100 | #331 | Tragic 17.8% |
| Natives/Alaskans | 0.0 /100 | #332 | Tragic 18.1% |
| Houma | 0.0 /100 | #333 | Tragic 18.4% |
| Apache | 0.0 /100 | #334 | Tragic 18.4% |
| Cheyenne | 0.0 /100 | #335 | Tragic 18.9% |
| Pueblo | 0.0 /100 | #336 | Tragic 19.4% |
| Sioux | 0.0 /100 | #337 | Tragic 19.8% |
| Yuman | 0.0 /100 | #338 | Tragic 20.2% |
| Crow | 0.0 /100 | #339 | Tragic 20.7% |
| Yup'ik | 0.0 /100 | #340 | Tragic 20.8% |
| Hopi | 0.0 /100 | #341 | Tragic 20.8% |
Demographics Similar to Immigrants from Israel by Poverty
In terms of poverty, the demographic groups most similar to Immigrants from Israel are South African (11.7%, a difference of 0.090%), Immigrants from Argentina (11.7%, a difference of 0.13%), Immigrants from Norway (11.7%, a difference of 0.14%), Immigrants from Brazil (11.7%, a difference of 0.18%), and Immigrants from Ukraine (11.8%, a difference of 0.19%).
| Demographics | Rating | Rank | Poverty |
| New Zealanders | 88.7 /100 | #121 | Excellent 11.7% |
| Puget Sound Salish | 88.7 /100 | #122 | Excellent 11.7% |
| Immigrants | Hungary | 88.6 /100 | #123 | Excellent 11.7% |
| Soviet Union | 88.4 /100 | #124 | Excellent 11.7% |
| Immigrants | Brazil | 88.2 /100 | #125 | Excellent 11.7% |
| Immigrants | Norway | 88.0 /100 | #126 | Excellent 11.7% |
| Immigrants | Argentina | 88.0 /100 | #127 | Excellent 11.7% |
| Immigrants | Israel | 87.4 /100 | #128 | Excellent 11.7% |
| South Africans | 87.0 /100 | #129 | Excellent 11.7% |
| Immigrants | Ukraine | 86.6 /100 | #130 | Excellent 11.8% |
| French | 86.1 /100 | #131 | Excellent 11.8% |
| Peruvians | 85.6 /100 | #132 | Excellent 11.8% |
| Immigrants | Western Europe | 85.2 /100 | #133 | Excellent 11.8% |
| Yugoslavians | 85.2 /100 | #134 | Excellent 11.8% |
| Immigrants | Vietnam | 85.2 /100 | #135 | Excellent 11.8% |