Apache vs Comanche Doctorate Degree
COMPARE
Apache
Comanche
Doctorate Degree
Doctorate Degree Comparison
Apache
Comanche
1.5%
DOCTORATE DEGREE
1.3/ 100
METRIC RATING
251st/ 347
METRIC RANK
1.6%
DOCTORATE DEGREE
1.8/ 100
METRIC RATING
247th/ 347
METRIC RANK
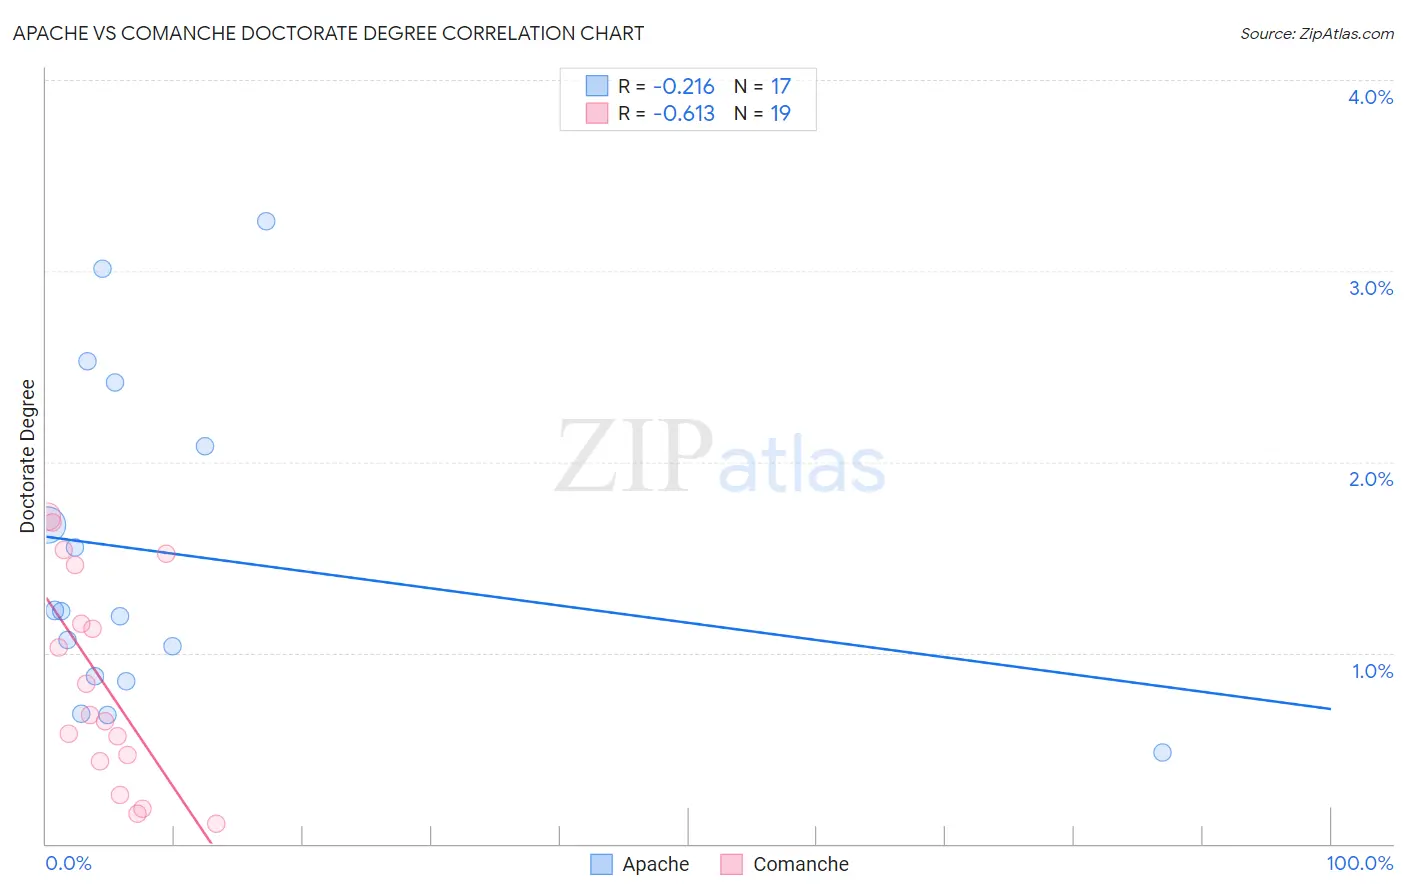
Apache vs Comanche Doctorate Degree Correlation Chart
The statistical analysis conducted on geographies consisting of 228,067,045 people shows a weak negative correlation between the proportion of Apache and percentage of population with at least doctorate degree education in the United States with a correlation coefficient (R) of -0.216 and weighted average of 1.5%. Similarly, the statistical analysis conducted on geographies consisting of 108,720,636 people shows a significant negative correlation between the proportion of Comanche and percentage of population with at least doctorate degree education in the United States with a correlation coefficient (R) of -0.613 and weighted average of 1.6%, a difference of 1.5%.
Doctorate Degree Correlation Summary
| Measurement | Apache | Comanche |
| Minimum | 0.48% | 0.10% |
| Maximum | 3.3% | 1.7% |
| Range | 2.8% | 1.6% |
| Mean | 1.5% | 0.85% |
| Median | 1.2% | 0.67% |
| Interquartile 25% (IQ1) | 0.86% | 0.43% |
| Interquartile 75% (IQ3) | 2.3% | 1.5% |
| Interquartile Range (IQR) | 1.4% | 1.0% |
| Standard Deviation (Sample) | 0.85% | 0.54% |
| Standard Deviation (Population) | 0.82% | 0.53% |
Demographics Similar to Apache and Comanche by Doctorate Degree
In terms of doctorate degree, the demographic groups most similar to Apache are Immigrants from Fiji (1.6%, a difference of 0.87%), Potawatomi (1.6%, a difference of 0.90%), Yuman (1.5%, a difference of 0.92%), American (1.5%, a difference of 1.1%), and Immigrants from Cambodia (1.5%, a difference of 1.2%). Similarly, the demographic groups most similar to Comanche are Hmong (1.6%, a difference of 0.020%), Delaware (1.6%, a difference of 0.12%), African (1.6%, a difference of 0.12%), French American Indian (1.6%, a difference of 0.49%), and Potawatomi (1.6%, a difference of 0.59%).
| Demographics | Rating | Rank | Doctorate Degree |
| West Indians | 2.5 /100 | #239 | Tragic 1.6% |
| Immigrants | Panama | 2.4 /100 | #240 | Tragic 1.6% |
| Cheyenne | 2.3 /100 | #241 | Tragic 1.6% |
| Ottawa | 2.2 /100 | #242 | Tragic 1.6% |
| Native Hawaiians | 2.1 /100 | #243 | Tragic 1.6% |
| French American Indians | 2.0 /100 | #244 | Tragic 1.6% |
| Delaware | 1.9 /100 | #245 | Tragic 1.6% |
| Hmong | 1.8 /100 | #246 | Tragic 1.6% |
| Comanche | 1.8 /100 | #247 | Tragic 1.6% |
| Africans | 1.8 /100 | #248 | Tragic 1.6% |
| Potawatomi | 1.6 /100 | #249 | Tragic 1.6% |
| Immigrants | Fiji | 1.6 /100 | #250 | Tragic 1.6% |
| Apache | 1.3 /100 | #251 | Tragic 1.5% |
| Yuman | 1.1 /100 | #252 | Tragic 1.5% |
| Americans | 1.0 /100 | #253 | Tragic 1.5% |
| Immigrants | Cambodia | 1.0 /100 | #254 | Tragic 1.5% |
| Trinidadians and Tobagonians | 1.0 /100 | #255 | Tragic 1.5% |
| Central American Indians | 1.0 /100 | #256 | Tragic 1.5% |
| Chippewa | 0.9 /100 | #257 | Tragic 1.5% |
| Immigrants | West Indies | 0.9 /100 | #258 | Tragic 1.5% |
| Liberians | 0.9 /100 | #259 | Tragic 1.5% |