Aleut vs Immigrants from Spain Single Mother Poverty
COMPARE
Aleut
Immigrants from Spain
Single Mother Poverty
Single Mother Poverty Comparison
Aleuts
Immigrants from Spain
32.9%
SINGLE MOTHER POVERTY
0.0/ 100
METRIC RATING
293rd/ 347
METRIC RANK
28.4%
SINGLE MOTHER POVERTY
89.2/ 100
METRIC RATING
135th/ 347
METRIC RANK
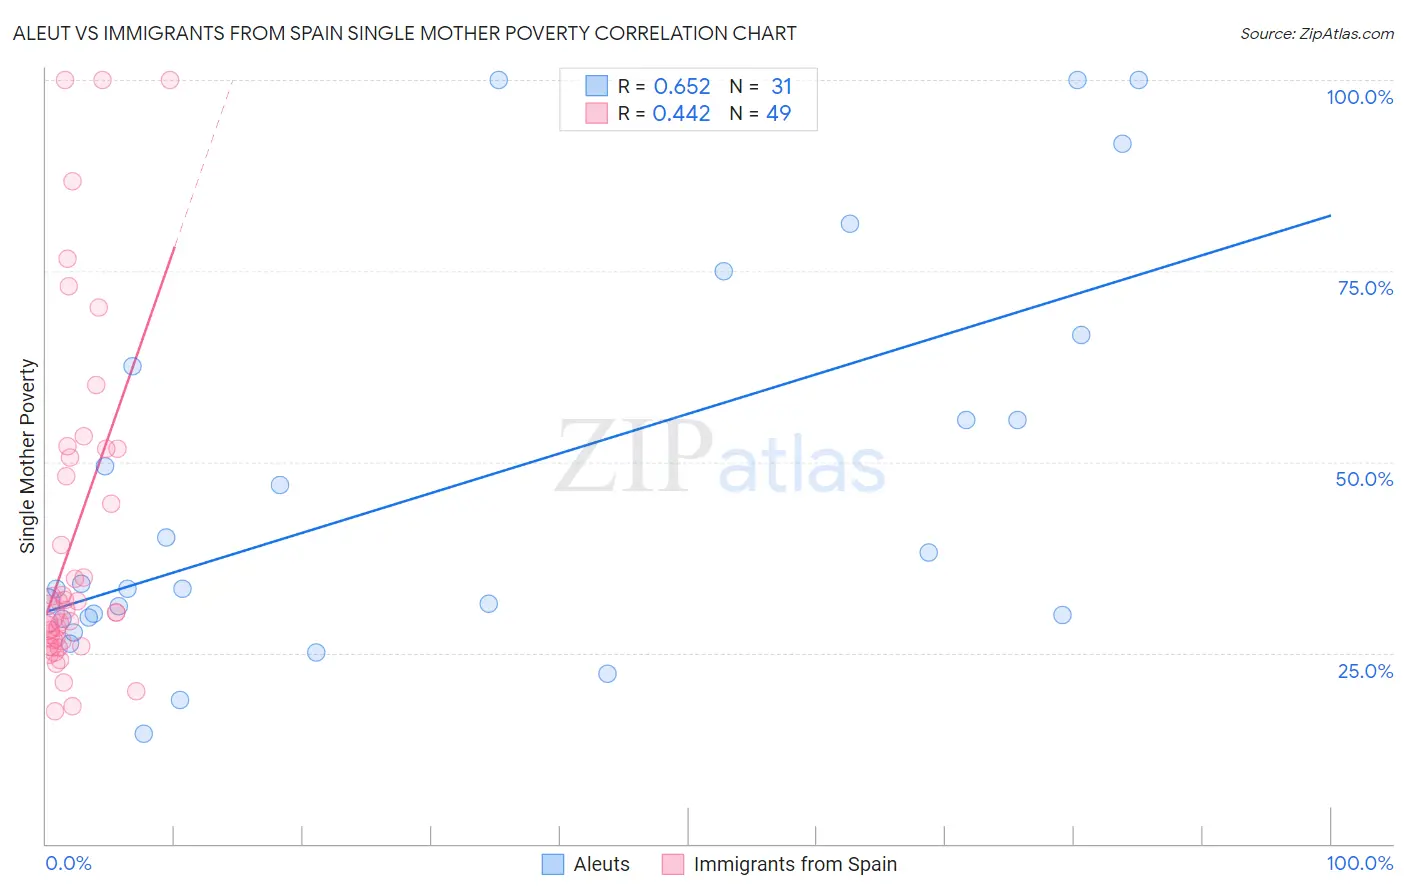
Aleut vs Immigrants from Spain Single Mother Poverty Correlation Chart
The statistical analysis conducted on geographies consisting of 61,416,159 people shows a significant positive correlation between the proportion of Aleuts and poverty level among single mothers in the United States with a correlation coefficient (R) of 0.652 and weighted average of 32.9%. Similarly, the statistical analysis conducted on geographies consisting of 235,531,441 people shows a moderate positive correlation between the proportion of Immigrants from Spain and poverty level among single mothers in the United States with a correlation coefficient (R) of 0.442 and weighted average of 28.4%, a difference of 15.8%.
Single Mother Poverty Correlation Summary
| Measurement | Aleut | Immigrants from Spain |
| Minimum | 14.4% | 17.3% |
| Maximum | 100.0% | 100.0% |
| Range | 85.6% | 82.7% |
| Mean | 46.6% | 40.1% |
| Median | 33.4% | 30.2% |
| Interquartile 25% (IQ1) | 29.6% | 26.2% |
| Interquartile 75% (IQ3) | 62.5% | 51.1% |
| Interquartile Range (IQR) | 32.9% | 25.0% |
| Standard Deviation (Sample) | 25.6% | 22.0% |
| Standard Deviation (Population) | 25.2% | 21.8% |
Similar Demographics by Single Mother Poverty
Demographics Similar to Aleuts by Single Mother Poverty
In terms of single mother poverty, the demographic groups most similar to Aleuts are Shoshone (32.9%, a difference of 0.030%), Guatemalan (32.9%, a difference of 0.050%), French American Indian (33.1%, a difference of 0.63%), Yaqui (33.1%, a difference of 0.66%), and Blackfeet (33.2%, a difference of 0.82%).
| Demographics | Rating | Rank | Single Mother Poverty |
| Yup'ik | 0.0 /100 | #286 | Tragic 32.5% |
| Immigrants | Dominica | 0.0 /100 | #287 | Tragic 32.5% |
| Somalis | 0.0 /100 | #288 | Tragic 32.6% |
| U.S. Virgin Islanders | 0.0 /100 | #289 | Tragic 32.6% |
| Osage | 0.0 /100 | #290 | Tragic 32.6% |
| Guatemalans | 0.0 /100 | #291 | Tragic 32.9% |
| Shoshone | 0.0 /100 | #292 | Tragic 32.9% |
| Aleuts | 0.0 /100 | #293 | Tragic 32.9% |
| French American Indians | 0.0 /100 | #294 | Tragic 33.1% |
| Yaqui | 0.0 /100 | #295 | Tragic 33.1% |
| Blackfeet | 0.0 /100 | #296 | Tragic 33.2% |
| Pennsylvania Germans | 0.0 /100 | #297 | Tragic 33.2% |
| Africans | 0.0 /100 | #298 | Tragic 33.3% |
| Immigrants | Guatemala | 0.0 /100 | #299 | Tragic 33.3% |
| Hispanics or Latinos | 0.0 /100 | #300 | Tragic 33.3% |
Demographics Similar to Immigrants from Spain by Single Mother Poverty
In terms of single mother poverty, the demographic groups most similar to Immigrants from Spain are Immigrants from Southern Europe (28.4%, a difference of 0.0%), Immigrants from Morocco (28.4%, a difference of 0.030%), Swedish (28.4%, a difference of 0.030%), Native Hawaiian (28.4%, a difference of 0.040%), and Immigrants from Canada (28.4%, a difference of 0.040%).
| Demographics | Rating | Rank | Single Mother Poverty |
| Immigrants | England | 90.5 /100 | #128 | Exceptional 28.4% |
| South Americans | 90.4 /100 | #129 | Exceptional 28.4% |
| Norwegians | 90.4 /100 | #130 | Exceptional 28.4% |
| Immigrants | Austria | 90.3 /100 | #131 | Exceptional 28.4% |
| Immigrants | Morocco | 89.5 /100 | #132 | Excellent 28.4% |
| Swedes | 89.4 /100 | #133 | Excellent 28.4% |
| Immigrants | Southern Europe | 89.2 /100 | #134 | Excellent 28.4% |
| Immigrants | Spain | 89.2 /100 | #135 | Excellent 28.4% |
| Native Hawaiians | 88.9 /100 | #136 | Excellent 28.4% |
| Immigrants | Canada | 88.9 /100 | #137 | Excellent 28.4% |
| Immigrants | Belgium | 88.5 /100 | #138 | Excellent 28.5% |
| Samoans | 88.1 /100 | #139 | Excellent 28.5% |
| Immigrants | Colombia | 88.0 /100 | #140 | Excellent 28.5% |
| Danes | 87.1 /100 | #141 | Excellent 28.5% |
| South Africans | 86.6 /100 | #142 | Excellent 28.5% |