Aleut vs Swiss Single Mother Poverty
COMPARE
Aleut
Swiss
Single Mother Poverty
Single Mother Poverty Comparison
Aleuts
Swiss
32.9%
SINGLE MOTHER POVERTY
0.0/ 100
METRIC RATING
293rd/ 347
METRIC RANK
29.7%
SINGLE MOTHER POVERTY
17.2/ 100
METRIC RATING
203rd/ 347
METRIC RANK
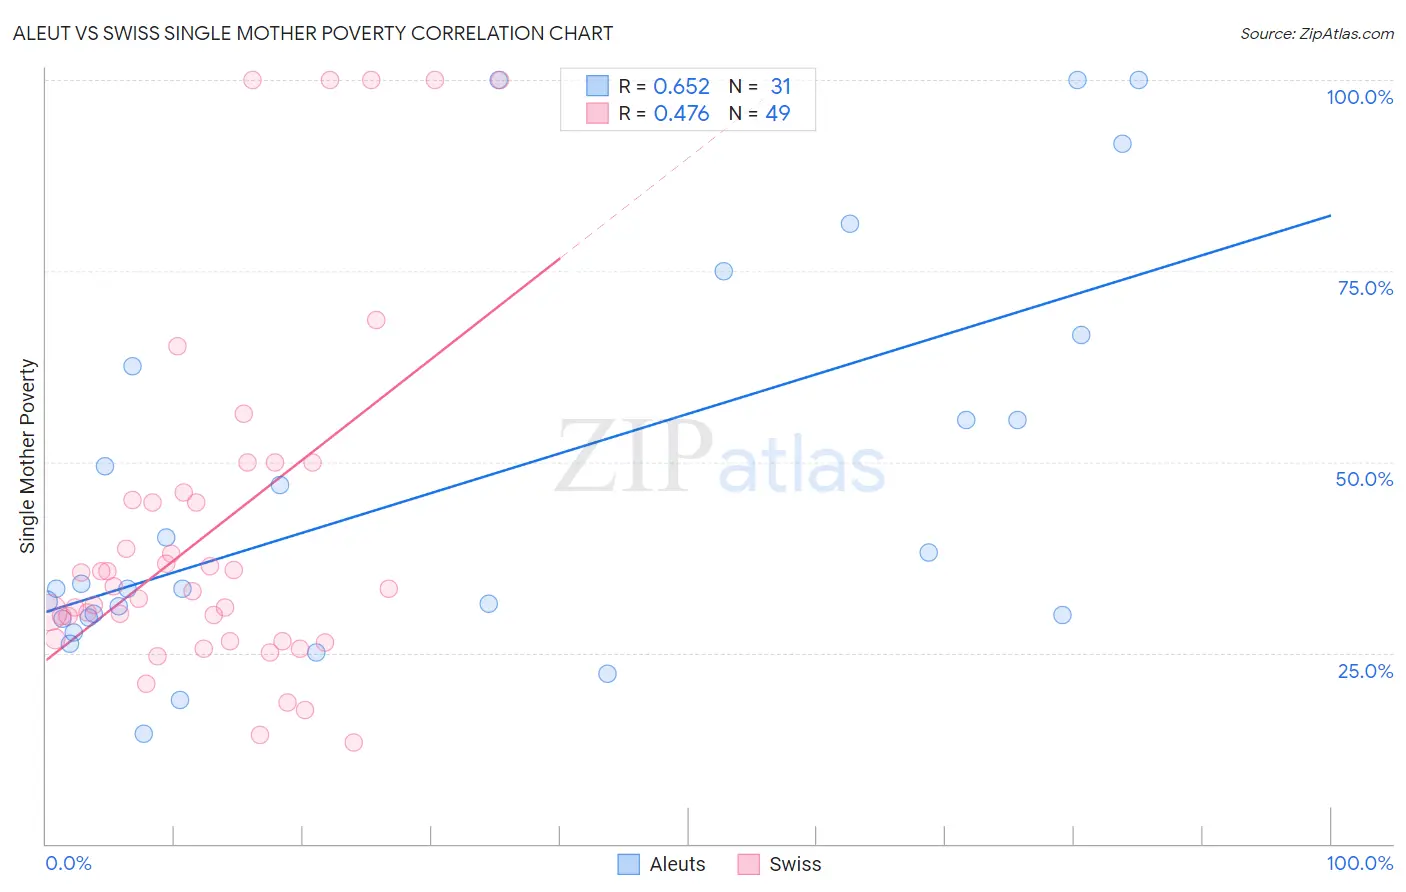
Aleut vs Swiss Single Mother Poverty Correlation Chart
The statistical analysis conducted on geographies consisting of 61,416,159 people shows a significant positive correlation between the proportion of Aleuts and poverty level among single mothers in the United States with a correlation coefficient (R) of 0.652 and weighted average of 32.9%. Similarly, the statistical analysis conducted on geographies consisting of 448,256,315 people shows a moderate positive correlation between the proportion of Swiss and poverty level among single mothers in the United States with a correlation coefficient (R) of 0.476 and weighted average of 29.7%, a difference of 10.8%.
Single Mother Poverty Correlation Summary
| Measurement | Aleut | Swiss |
| Minimum | 14.4% | 13.3% |
| Maximum | 100.0% | 100.0% |
| Range | 85.6% | 86.7% |
| Mean | 46.6% | 41.0% |
| Median | 33.4% | 33.3% |
| Interquartile 25% (IQ1) | 29.6% | 26.7% |
| Interquartile 75% (IQ3) | 62.5% | 45.5% |
| Interquartile Range (IQR) | 32.9% | 18.8% |
| Standard Deviation (Sample) | 25.6% | 23.1% |
| Standard Deviation (Population) | 25.2% | 22.8% |
Similar Demographics by Single Mother Poverty
Demographics Similar to Aleuts by Single Mother Poverty
In terms of single mother poverty, the demographic groups most similar to Aleuts are Shoshone (32.9%, a difference of 0.030%), Guatemalan (32.9%, a difference of 0.050%), French American Indian (33.1%, a difference of 0.63%), Yaqui (33.1%, a difference of 0.66%), and Blackfeet (33.2%, a difference of 0.82%).
| Demographics | Rating | Rank | Single Mother Poverty |
| Yup'ik | 0.0 /100 | #286 | Tragic 32.5% |
| Immigrants | Dominica | 0.0 /100 | #287 | Tragic 32.5% |
| Somalis | 0.0 /100 | #288 | Tragic 32.6% |
| U.S. Virgin Islanders | 0.0 /100 | #289 | Tragic 32.6% |
| Osage | 0.0 /100 | #290 | Tragic 32.6% |
| Guatemalans | 0.0 /100 | #291 | Tragic 32.9% |
| Shoshone | 0.0 /100 | #292 | Tragic 32.9% |
| Aleuts | 0.0 /100 | #293 | Tragic 32.9% |
| French American Indians | 0.0 /100 | #294 | Tragic 33.1% |
| Yaqui | 0.0 /100 | #295 | Tragic 33.1% |
| Blackfeet | 0.0 /100 | #296 | Tragic 33.2% |
| Pennsylvania Germans | 0.0 /100 | #297 | Tragic 33.2% |
| Africans | 0.0 /100 | #298 | Tragic 33.3% |
| Immigrants | Guatemala | 0.0 /100 | #299 | Tragic 33.3% |
| Hispanics or Latinos | 0.0 /100 | #300 | Tragic 33.3% |
Demographics Similar to Swiss by Single Mother Poverty
In terms of single mother poverty, the demographic groups most similar to Swiss are Malaysian (29.7%, a difference of 0.020%), Immigrants (29.7%, a difference of 0.050%), Czechoslovakian (29.7%, a difference of 0.10%), Belgian (29.7%, a difference of 0.12%), and Immigrants from Haiti (29.7%, a difference of 0.12%).
| Demographics | Rating | Rank | Single Mother Poverty |
| Spanish American Indians | 23.4 /100 | #196 | Fair 29.6% |
| Immigrants | Jamaica | 22.0 /100 | #197 | Fair 29.6% |
| Trinidadians and Tobagonians | 21.7 /100 | #198 | Fair 29.6% |
| Cubans | 20.8 /100 | #199 | Fair 29.6% |
| Panamanians | 20.0 /100 | #200 | Fair 29.6% |
| Belgians | 18.8 /100 | #201 | Poor 29.7% |
| Malaysians | 17.4 /100 | #202 | Poor 29.7% |
| Swiss | 17.2 /100 | #203 | Poor 29.7% |
| Immigrants | Immigrants | 16.6 /100 | #204 | Poor 29.7% |
| Czechoslovakians | 16.1 /100 | #205 | Poor 29.7% |
| Immigrants | Haiti | 15.8 /100 | #206 | Poor 29.7% |
| Immigrants | Panama | 15.5 /100 | #207 | Poor 29.8% |
| Immigrants | Guyana | 14.7 /100 | #208 | Poor 29.8% |
| Irish | 13.9 /100 | #209 | Poor 29.8% |
| Haitians | 13.3 /100 | #210 | Poor 29.8% |